
Why Manual Grid Inspections Still Miss Failure Risks
The patrol passed. The detailed inspection passed. The line failed anyway. Here is where manual inspection programs lose the defect - and the numbers behind each gap.
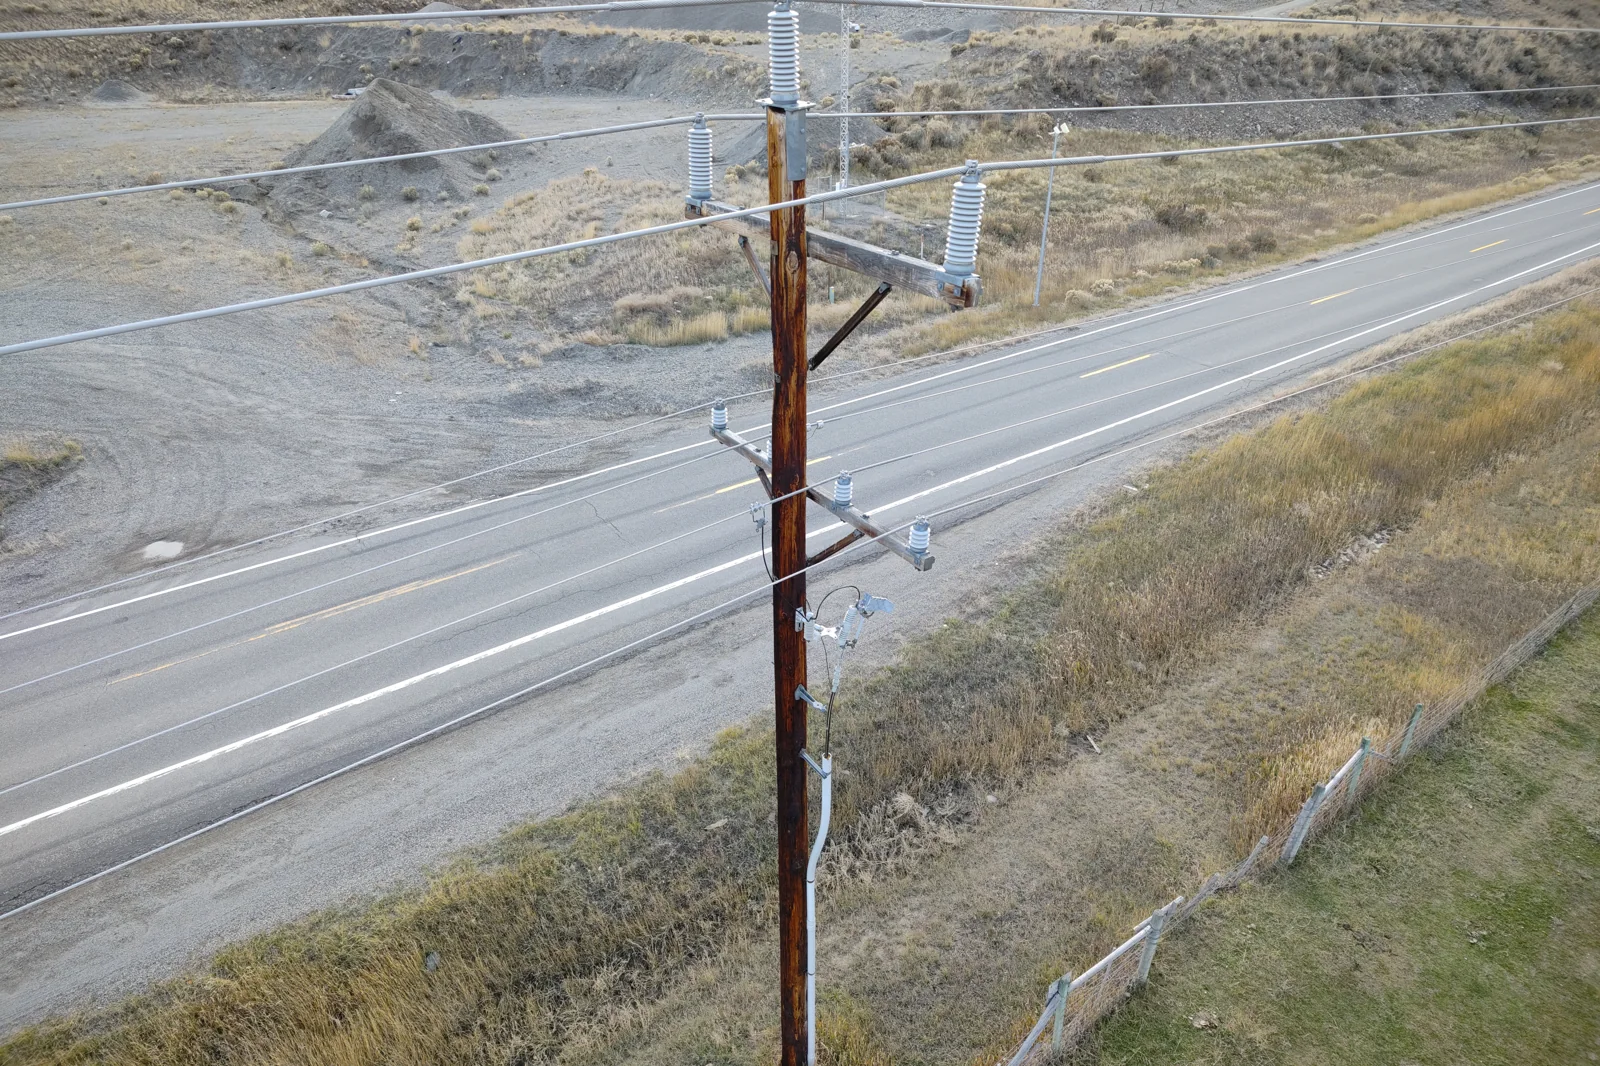
- Regulation defines a patrol as a simple visual inspection for obvious hazards. California's GO 165 requires a detailed look only every five years, and never requires climbing (CPUC GO 165).
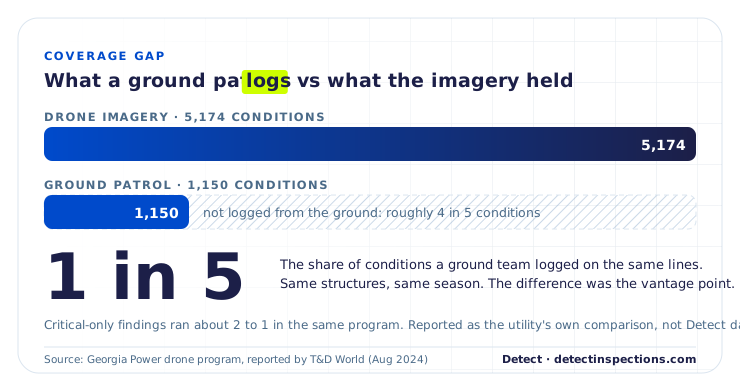
- Ground crews log about 1 in 5 of the conditions imagery holds. Georgia Power's ground teams recorded 1,150 conditions on lines where drone imagery found 5,174 (T&D World, 2024).
- Human visual inspection is inconsistent by nature. In the FHWA's benchmark study, in-depth visual inspections found the implanted defects 3.9% of the time (FHWA, 2001).
- Latency is where a caught defect becomes an outage anyway. At the end of 2023 one California utility carried 921,117 open maintenance notifications. 97% sat in the two lowest priority tiers (CPUC, 2024).
- A finding you cannot place, prove, or compare is not a record. Investigators could not tell whether the Camp Fire tower had ever been climb-inspected, because records before 2000 were not available (Butte County DA, 2020).
None of the three gaps is the crew's fault. Weather triggers the outage; the gap is why the structure was weak when the weather arrived. Detect's position is simple: decision-grade grid intelligence comes from every image, across your entire network, or it does not come at all. This guide is the case for that standard, made from the inspection program's side.
- What causes power grid failures even with manual inspections?
- The coverage gap
- The latency gap
- The record gap
- Which inspection method closes which gap?
- How the gaps show up in reliability metrics
- How to find the gaps in your own program
- FAQ
What causes power grid failures even with manual asset inspections?
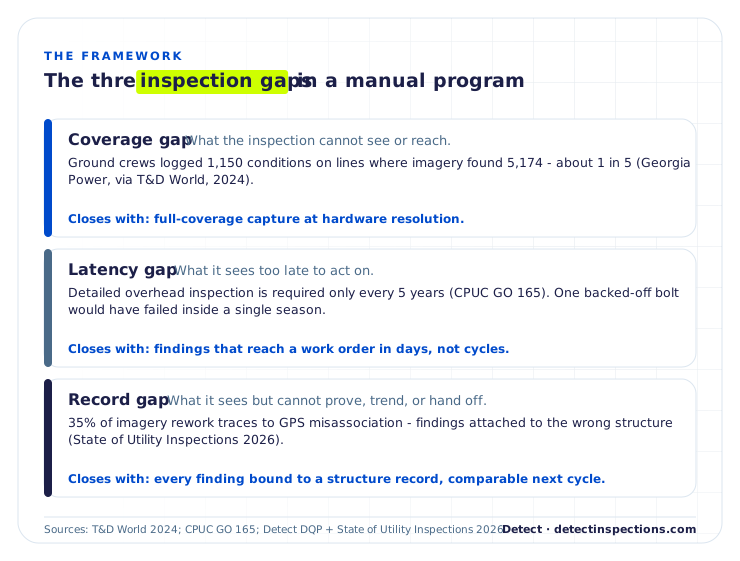
Power grid failures happen despite manual inspections because the inspection program has gaps the failure can develop inside. The coverage gap is what the inspection cannot see or reach. The latency gap is what it sees too late to act on. The record gap is what it sees but cannot prove, trend, or hand off to the people who fix it. A structure can pass every scheduled visit and still fail, because the defect lived in one of those three gaps.
The causes themselves are well documented. Weather was the trigger for about 80% of US outages between 2000 and 2023 (ASCE, 2025). Aging hardware is the amplifier; vegetation, equipment defects, and rising load sit underneath. Detect's guide to power grid failure causes works through that stack and the reliability-centered maintenance response. This guide stays on one question: why the inspection program did not see the failure coming.
Which equipment failures develop between inspections?
The ones with a clock faster than the cycle. Connectors heat and cool with every daily peak. Corrosion crosses from detectable to critical. Wood decays fastest at the groundline, out of sight. Storm-loaded hardware stands weakened until the next event. Excluding storms, equipment failures, tree contacts, and accidents caused about 77% of interruptions in New York State in 2022. The largest driver of equipment failure was conductor and cable failure, which the report attributes to asset age (NY DPS, 2023).
Every one of those failures has a window between the moment it becomes detectable and the moment it takes the line down. Detect calls that the Failure Window: Detectable, Developing, Down. A manual program catches the defect only if a visit lands inside the window and the visit can see it. The three gaps are the three ways that fails.
What is the coverage gap in manual asset inspection?
The coverage gap is the share of a structure's defect-bearing surfaces that the inspection method cannot see or reach. It is set by the method before the crew leaves the yard. California's General Order 165 defines a patrol as "a simple visual inspection ... designed to identify obvious structural problems and hazards," and allows it to be "carried out in the course of other company business" (CPUC GO 165). That is an honest description of what a patrol is for. It is not a description of a hardware inspection.
What can a ground patrol not see?
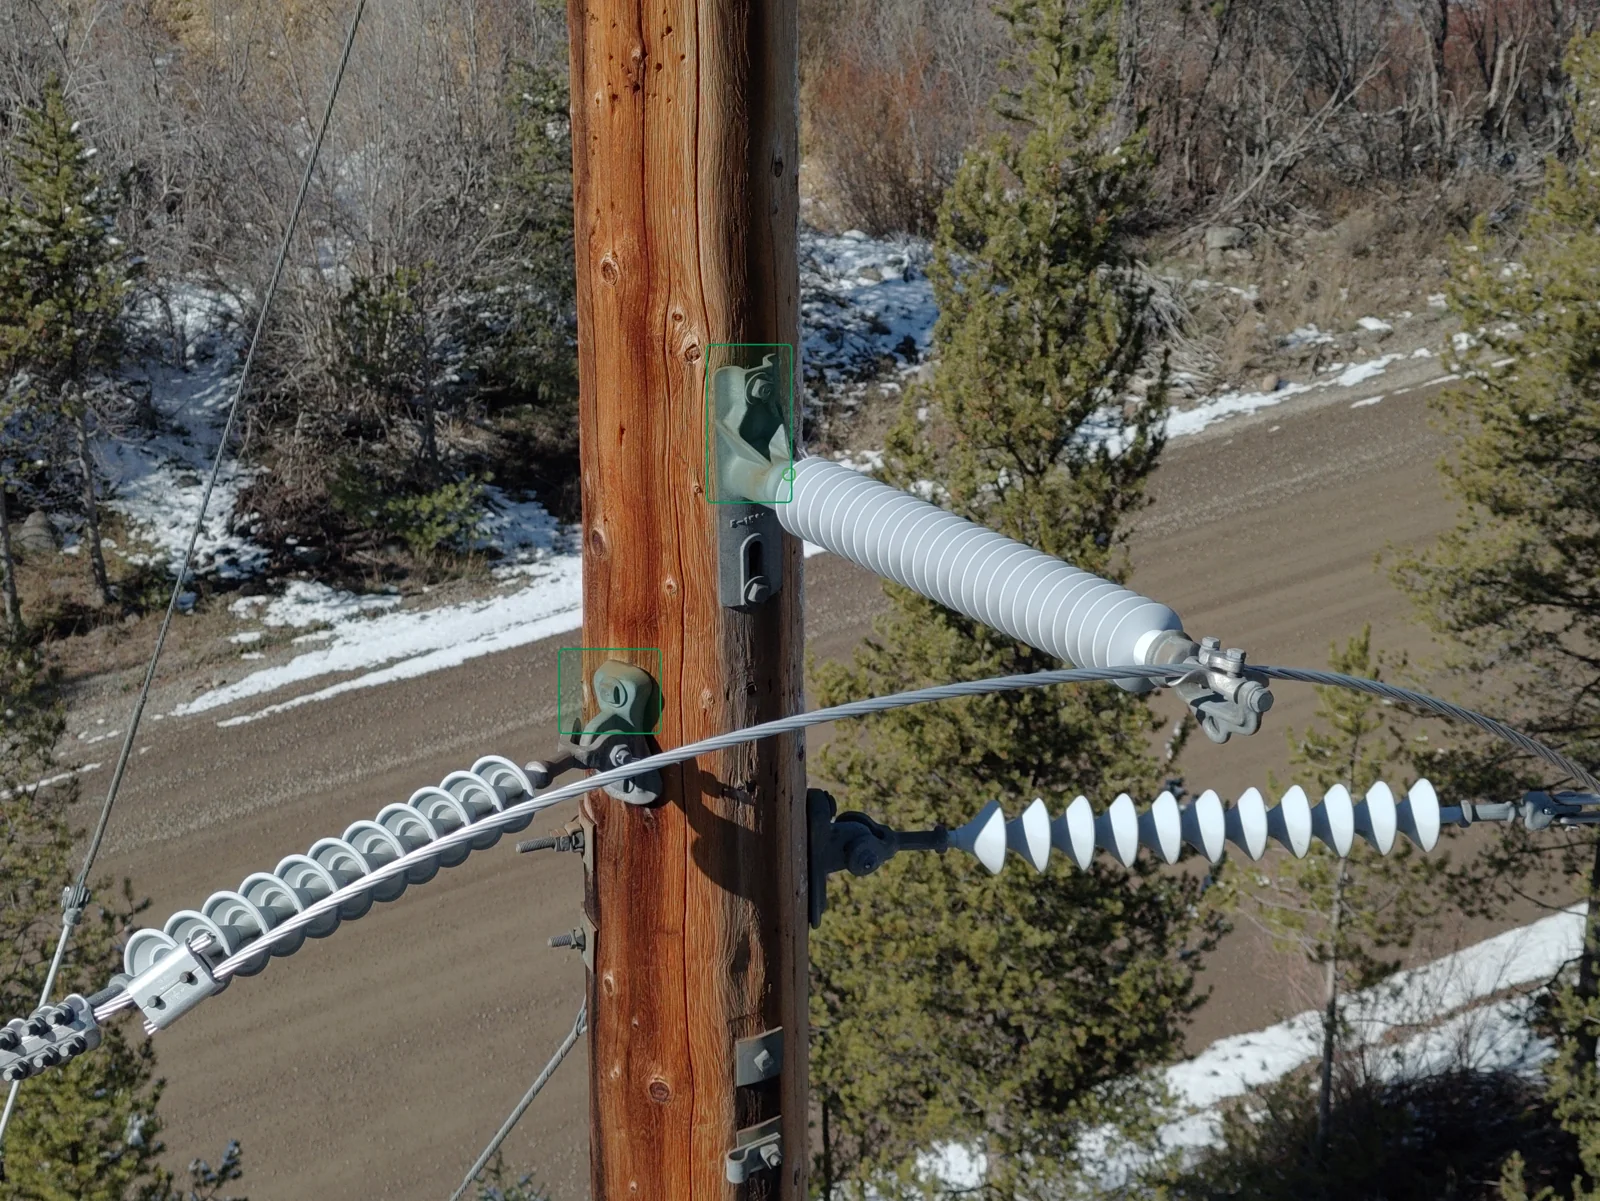
Anything smaller than a silhouette at conductor height, and anything internal. From the ground, an inspector sees the pole, the crossarm, and the outline of the insulator string. What they cannot resolve is the list that causes outages:
- a cotter key that has walked out of a clevis
- a nut backed off a pin
- a split on the top face of a crossarm
- corrosion under a fitting
- the wear on a hook that has carried a conductor for decades
The size of the gap has been measured by a utility on its own lines. Georgia Power's ground teams logged 1,150 conditions on lines where drone imagery found 5,174 - about 1 in 5 (T&D World, 2024). Same structures, same season. The difference was the vantage point.
Below grade the gap runs the other way. The USDA's wood-pole bulletin is blunt about visual inspection. Since most decay is underground or internal, the method "will not detect the majority of defective poles." Sound-and-bore reaches only "as high as the inspector can reach" (USDA RUS Bulletin 1730B-121, 2013). Groundline inspection and overhead imagery each cover the other's blind spot, which is why a mature pole program runs both.
How long is an inspection cycle?
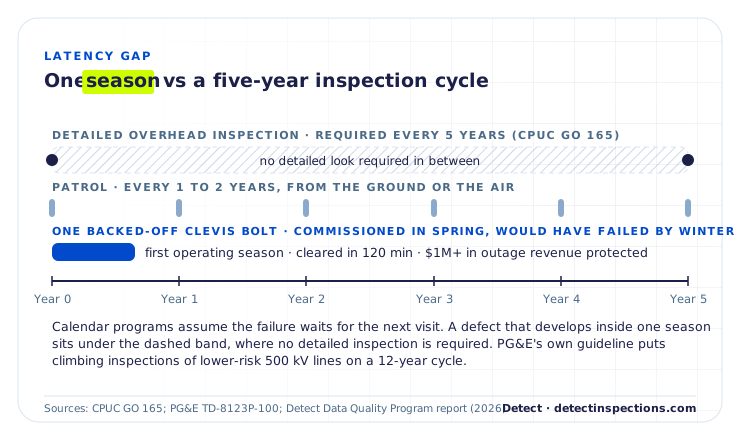
Longer than the failures. GO 165 requires a patrol every one to two years on overhead distribution and a detailed inspection every five years. Wood poles get an intrusive inspection every 10 years, or every 20 once they have passed (CPUC GO 165). PG&E's transmission guideline puts climbing inspections of lower-risk 500 kV lines on a 12-year cycle. Its pole program inspects roughly 10% of wood poles intrusively each year (PG&E TD-2325P-01). Set a defect that develops in one season against a cycle measured in years and the surprise is not that lines fail. It is that more of them do not.
Even the visit that lands inside the window is not a guarantee. The Federal Highway Administration put 49 inspectors from 25 state agencies through the same bridges. Only 68% of routine condition ratings fell within one point of the average. In-depth visual inspections found the implanted defects 3.9% of the time (FHWA, 2001). Bridges are not power lines, but eyes are eyes. A visual inspection is an estimate by a person, and two people estimate differently.
A new line is not a clean line. On a brand-new 345 kV build, a 927-structure construction QA program found 67 critical conditions before the warranty closed - about 1 structure in 14. Fifty-one of the 67 sat in one segment (Detect and CompassData, 2026). Risk clusters. A sample-based patrol would have found a fraction of the issues and none of the pattern.
Why does capture quality decide what is assessable?
Because closing the coverage gap with imagery only works if the imagery can be read. On Detect's 258-type, 19-class defect catalog, sharp imagery leaves 100% of the catalog assessable. Soft imagery drops that to 69%. Blurry imagery leaves 7%, a drop from 258 identifiable defect types to roughly 18 (Detect Data Quality Program asset-owner report, 2026). The fastener-level defects that cause outages are the first to vanish when capture slips. That is the assessability ceiling, and it is the reason a capture standard belongs in the inspection contract, not the vendor's brochure.
What is the latency gap in infrastructure maintenance?
The latency gap is the time between the moment a defect is captured and the moment a crew has a work order for it. During that time the defect keeps developing. In a manual program the finding travels from field notes to a report, then to an engineer's review, then to a maintenance notification, then to a schedule. Each handoff is honest work. Each one is also days the Failure Window does not give back.
The regulatory record shows how long that road can be. In 2021 the CPUC fined one utility $5 million for inadequate inspections of two transmission lines from 2008 through 2019. The citation also covered 22 high-priority deficiencies on 21 towers that were not corrected within the time allowed; the last fixes were completed in April 2020 (CPUC, 2021). The same utility reported that 54,755 distribution poles had not received their routine detailed inspection in 2019. By the end of 2023 it carried 921,117 open maintenance notifications, 97% of them in the two lowest priority tiers. It asked the regulator for relief from the repair deadlines on them (CPUC, 2024). A backlog that size is not a staffing story. It is what a program looks like when findings arrive faster than the pipeline that turns them into work.
On a newly built ~250-mile HVDC intertie of roughly 2,600 lattice towers, a 3-person team captured 122,714 images in 30 days. AI screening cleared 99% of them; expert review left 1,270 findings. One was a clevis bolt with its cotter key missing, high in a suspension assembly, in the line's first operating season. Clearing it took 120 minutes of field time and protected $1M+ in forced-outage revenue (Detect Data Quality Program report, 2026).
Rework is latency too. Across the industry, 15 to 25% of delivered inspection imagery is reworked before it can be analyzed. About 30% of ad-hoc capture is rejected outright (Detect, State of Utility Inspections 2026). Every re-fly is a second field visit before the clock on analysis even starts. Programs that adopt a capture standard cut rework to 3 to 7% within two campaigns.
The counter-example is a program built so the register is the deliverable. In the 345 kV construction program above, the image-linked defect register was delivered within 72 hours of the last flight. Every critical finding carried the photo, the structure, and the location a crew needed to act. Getting from that register to a scheduled repair is the subject of Detect's guide to inspection-to-maintenance orchestration. The short version: the fewer times a finding is re-keyed, the shorter the latency gap.
What is the record gap in asset inspection?
The record gap is the difference between a finding that exists and a finding that can be placed, proved, and compared. A patrol note that says "hardware worn, structure 27" is a finding. It is not a record until it is bound to that structure, carries evidence someone else can open, and can be set beside the same structure's condition last cycle. Most manual programs stop at the note.
In 2026 the record gap became a compliance gap. Texas pole inspection plans, nine states' substantial-compliance safe harbors, and FEMA's pre-incident photograph rule all read the same structure-level record - the 2026 utility inspection requirements guide lists what each one asks a utility to prove.
The clearest illustration is also the hardest one. When the Butte County District Attorney investigated the 2018 Camp Fire, the office found that the utility's inspection and patrol records before 2000 were not available. It could not determine whether the tower that failed had ever received a climbing inspection (Butte County DA, 2020). The CPUC's safety division separately cited a failure to inspect the tower thoroughly. It also cited a failure to conduct climbing inspections when the triggering conditions were evident (CPUC SED, 2019). A worn hook at height is a coverage gap. Not being able to show whether anyone had ever looked at it is a record gap.
The gap starts smaller and closer to home. A photo attached to the wrong structure is a finding nobody will ever act on. In Detect's analysis of delivered drone imagery, GPS-based misassociation accounted for 35% of all rework (Detect, State of Utility Inspections 2026). The utility's photo data quality standard has to cover association and comparability, not just sharpness, or the trend never appears. Governance is thin across the sector. In EY's survey of power and utility executives, 57% rated their data governance at the two lowest maturity levels, and only 29% had a formal data strategy (EY, 2021).
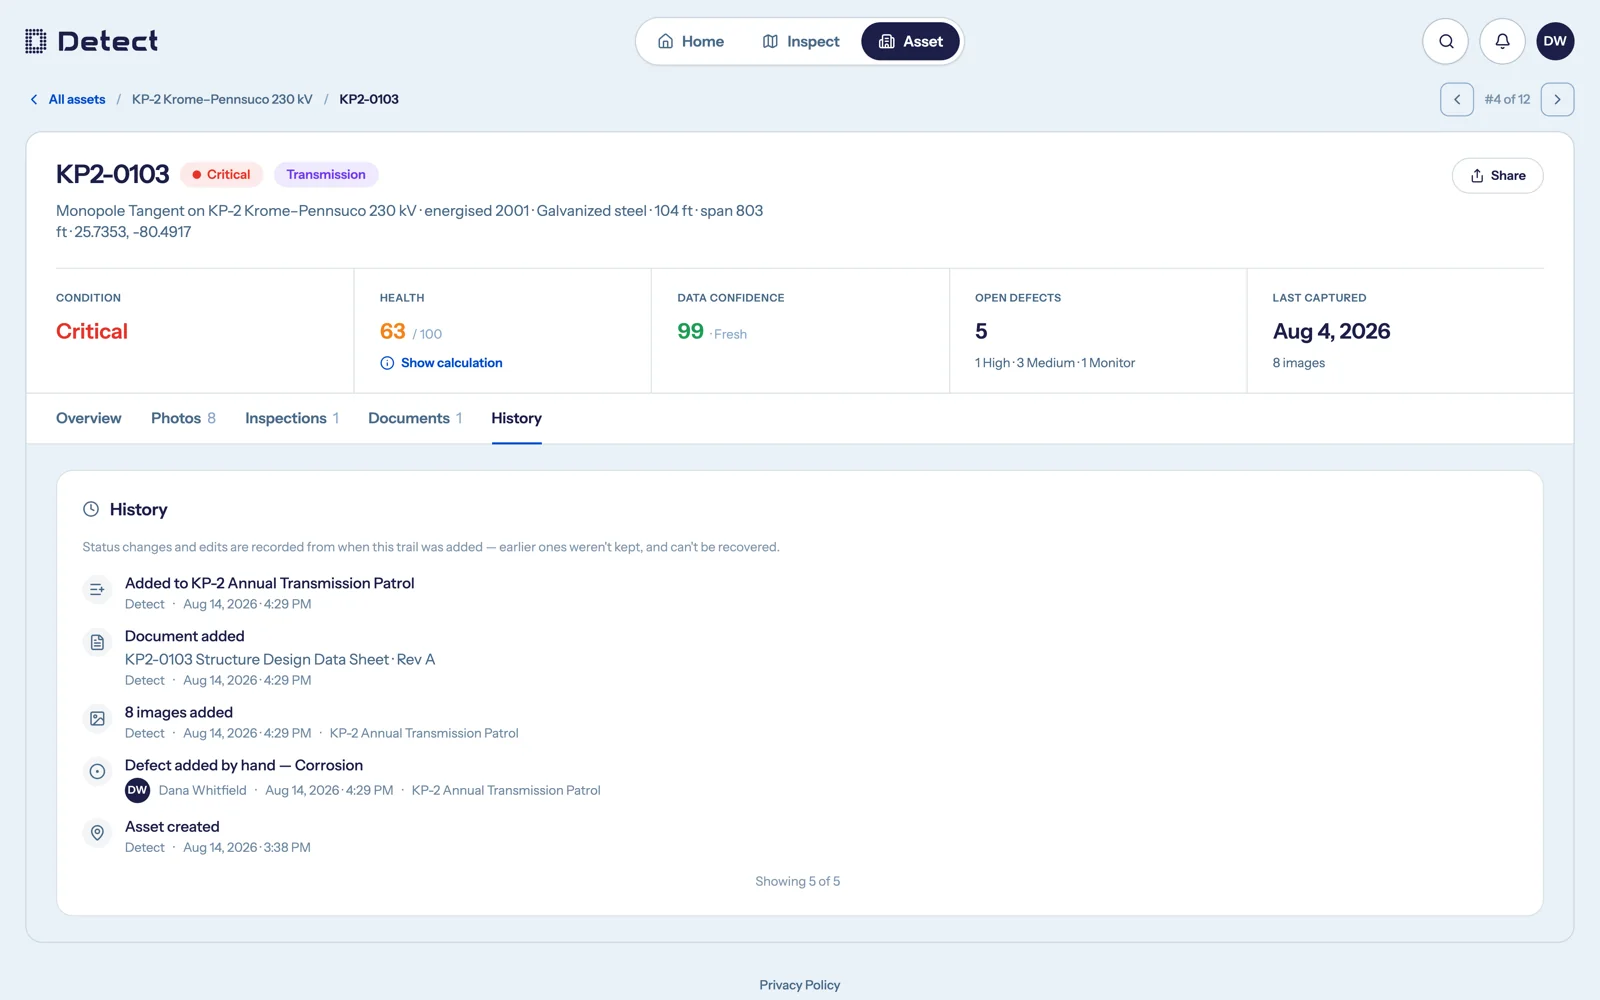
What a closed record gap buys you is easiest to see when the money is on the table. Two 40-plus-year-old wooden H-frame lines had been patrolled for a decade while capital requests were turned down. A 3-person drone crew captured all 96 structures in one field day, and expert review flagged 55 high-risk conditions across the two lines: rotten poles, missing through-bolts, splitting crossarms. The rebuild was approved in a meeting that lasted under 10 minutes (Detect case study, 2026). The conditions were not new. The evidence was. Findings you can verify, share, and audit are a different thing from "looked fine through binoculars."
The same record is what a regulator asks for after the fact. Wildfire mitigation plans, GO 165 record-keeping, and NERC's vegetation standard all assume you can produce the inspection, the finding, and the date. Detect's seven checks for AI inspection results end on that question: would the record survive an audit?
Which inspection method closes which gap?
No single method closes all three, which is why the honest answer is a program rather than a purchase. The table below is method-neutral. It describes what each method covers, how fast its findings move, and what record it leaves.
| Method | Coverage | Latency | Record |
|---|---|---|---|
| Ground patrol | Obvious hazards from the road; hardware at height reads as a silhouette | Notes to report to work order, each a handoff | Notes, sometimes photos; rarely bound to the structure record |
| Climbing / detailed inspection | Close-range hardware on the structures it reaches; five-year cadence; crew exposure | Same reporting chain | Condition ratings; inspector-dependent (FHWA) |
| Groundline intrusive (sound-and-bore, excavation) | Decay below grade; nothing above the inspector's reach (USDA RUS) | 8 to 12-year cycle | Pole-level pass/reject |
| Helicopter patrol | Fast corridor coverage; catches the obvious, misses the subtle | Fast capture, slow review | Video and notes |
| Drone capture + AI screening + expert review | Hardware-resolution imagery of every structure; assessability set by capture quality | Register in days (72 hours on the 345 kV program) | Every finding bound to a structure with its image; comparable next cycle |
| Vehicle capture (distribution) | 1,000+ roadside poles a day at road speed; off-road spans need drone or foot | Same review pipeline | Same structure record |
Two rows deserve a note. Groundline inspection is not replaced by imagery; internal decay defeats every camera, and the sensor selection guide explains why. And the drone row only earns its coverage claim when the capture meets a standard, which is the point of the assessability tiers above. Detect's vehicle unit shows how far the coverage side can go on distribution: 1,000+ poles a day, each frame bound to a pole record as it is taken. The full comparison of capture methods for utility inspection covers cost and access.
How do inspection gaps show up in grid reliability metrics?
As interruptions filed under weather. US electricity customers averaged 11 hours of interruptions in 2024, about nine of them during major events (EIA, 2025). More than 90% of interruptions begin on the distribution system (DOE QER, 2017). Oak Ridge National Laboratory puts the cost of outages to US customers at about $67 billion a year on average, and $121 billion in 2024 (ORNL, 2026). Behind those numbers is a grid in which 70% of transmission lines are 25 years or older. The American Society of Civil Engineers grades US energy infrastructure a D+ (ASCE, 2025).
The reliability index does not record why the conductor was weak when the wind came. It records the wind. That is why grid reliability depends on inspection turnaround more than on inspection count. A defect found inside its window and repaired on schedule never enters SAIDI or SAIFI at all. The alternative is priced in the guide to the cost of reactive maintenance.
How do you find the gaps in your own inspection program?
With three audits and one flight, in about 30 days. None of them requires new software. They require the records you already have and an honest count.
- Run a coverage audit on one aging line. Pull last cycle's findings per structure. Count the structures with zero findings on record. On a 40-year-old line a long run of clean structures is a coverage signal, not a clean bill of health.
- Time your last 20 critical findings. For each, record the date of capture and the date a work order opened. The median is your latency gap. Note where the days went: field notes, report, engineering review, or the maintenance system.
- Try to trend one component across two cycles. Pick a hardware class, find the same structure in the last two inspections, and compare. If you cannot find the pair, or the two records cannot be compared, the record gap is your first project.
- Grade a sample of your imagery for assessability. Sort 100 recent images into sharp, soft, and blurry. Sharp imagery makes the full 258-type defect catalog assessable; blurry imagery leaves 7%. The share that is soft or blurry is coverage you paid for and did not get.
- Fly one line at full coverage and compare it to the patrol record. Capture every structure at hardware resolution, run AI screening with expert review, and set the findings against what the patrol logged. The difference is the size of your coverage gap, in your own numbers.
When the numbers come back, the response is the same in every program Detect has seen.
- Close the coverage gap with full-coverage capture at a stated quality standard.
- Close the latency gap by delivering a structure-bound register instead of a report.
- Close the record gap by keeping every finding on the structure's timeline, so the next cycle has something to compare against.
AI screens the volume. Your experts review the findings. Detect calls that Hybrid AI + Expert Review, and it is the difference between more data and a shorter list of the defects that matter.
The bottom line
Manual inspections do not miss failure risks because crews are careless. They miss them because a patrol is designed to catch the obvious. A five-year cycle is longer than a one-season failure. A finding that takes months to reach a work order keeps developing. A note that cannot be placed or compared is not a record. Weather will keep taking the blame. The program decides whether the structure was ready for it.
See what your last inspection missed
Send Detect a recent inspection dataset - drone, vehicle, or ground photos. We will grade its capture quality against the assessability tiers, run AI screening with expert review, and show you the findings the patrol record does not contain.
Book a free audit →