
Why AI Inspections Miss Defects: The Assessability Ceiling
AI can grade a power line in seconds. It still cannot find what the camera never captured, and that gap, not the model, is where utility inspections fail.
In an 1864 memoir, Charles Babbage, who designed the first mechanical computer, recounted a question two members of Parliament had put to him: "Pray, Mr. Babbage, if you put into the machine wrong figures, will the right answers come out?"
"I am not able rightly to apprehend the kind of confusion of ideas that could provoke such a question."
Charles Babbage, 1864
A century and a half later, the confusion he could not fathom is standard practice in utility inspection.
AI models read aerial imagery and return verdicts on the condition of the grid. The models are good. The question almost no one asks is the one the MPs asked Babbage: what went into the machine, and was it any good?
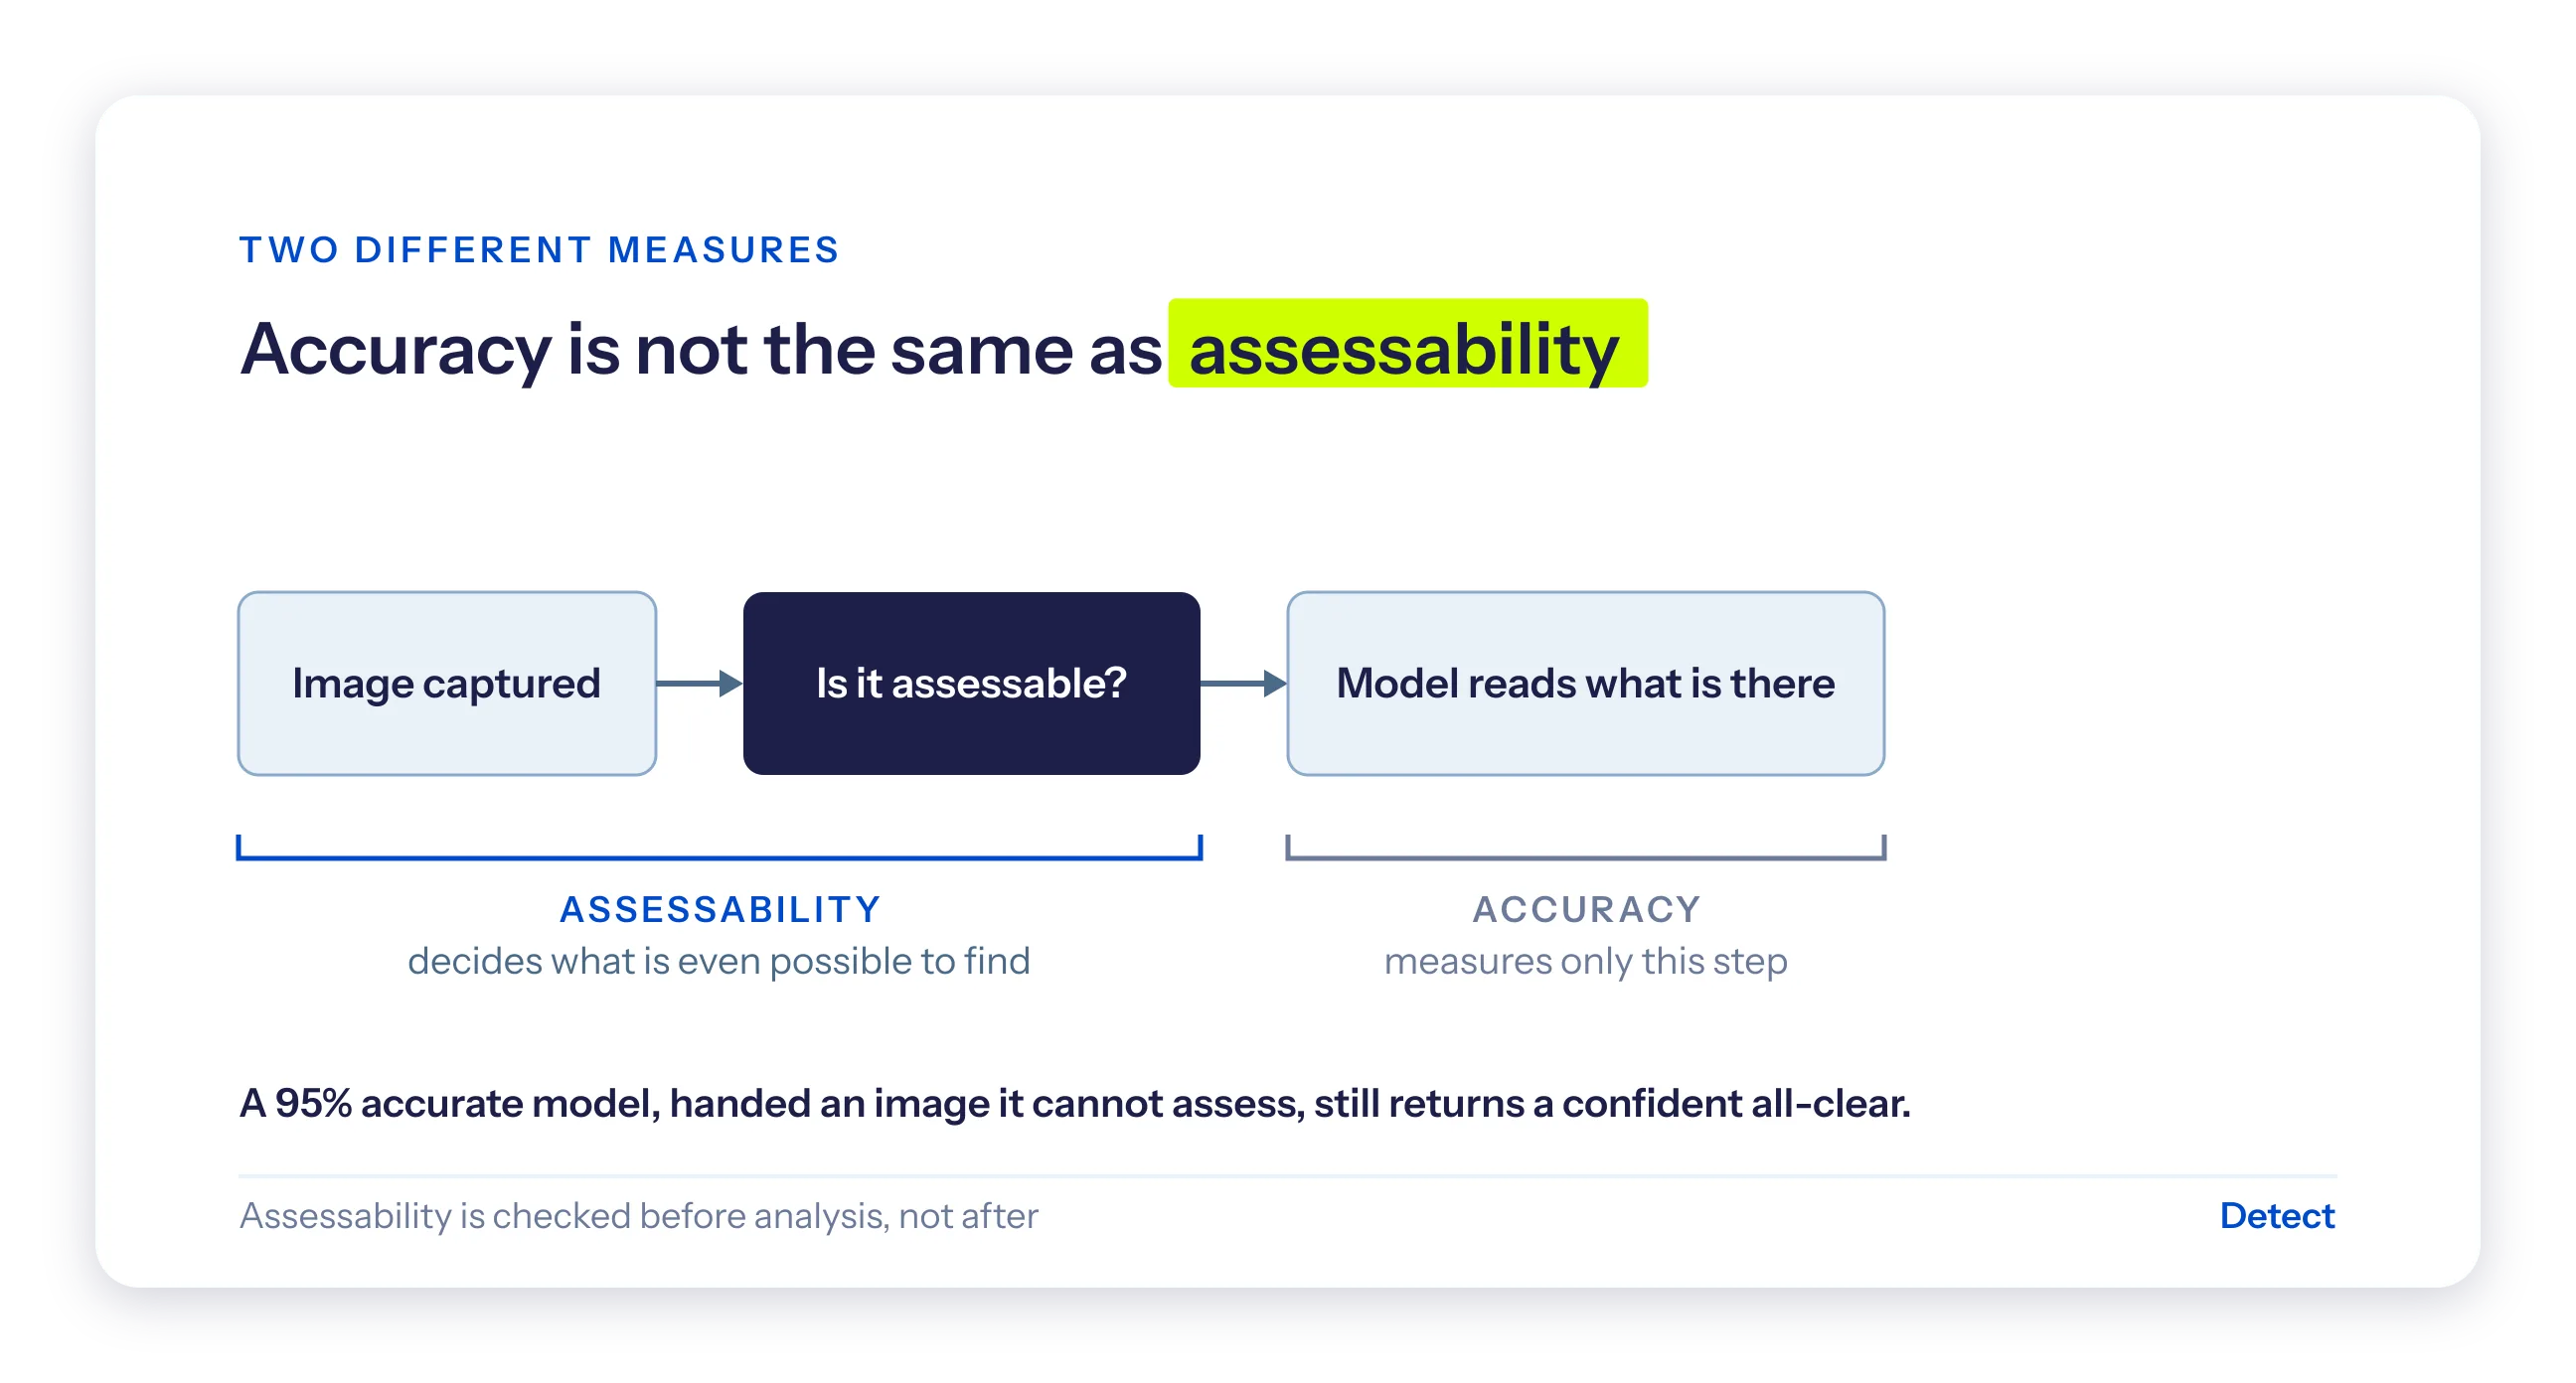
Feed a defect model a photograph that cannot resolve the defect, and it will hand back a clean report with complete confidence. Wrong figures in. Right-looking answers out.
This is the most important and least discussed limit in AI-powered inspection. It has a name. The assessability ceiling.
The state of AI utility inspection in 2026
An aging grid, inspected at scale
The U.S. grid is vast and old. By the 2025 Infrastructure Report Card, it runs to roughly:
- 600,000 miles of transmission lines, about 240,000 of them high-voltage at 230 kV or above.
- 5.5 million miles of distribution lines.
- More than 180 million poles.
And it is old. Much of the bulk system was built in the 1950s and 1960s against a 50-year design life, and ASCE graded U.S. energy infrastructure a D+ in 2025.
Roughly 70% of U.S. transmission lines are now 25 years or older.
Age, though, is a poor proxy for risk, a point we make in transmission past its design life. The broader shift in utility asset management is toward condition data over calendar assumptions. The assets carrying the most load are often the oldest.
Inspection goes airborne and BVLOS
Transmission and distribution (T&D) operators and their drone service providers (DSPs) now fly corridors with drones and helicopters carrying RGB, thermal, and LiDAR payloads.
The FAA's proposed Part 108 rule, an NPRM released in 2025 with a final rule expected in 2026, would replace the waiver system with a framework for routine Beyond Visual Line of Sight (BVLOS) flight.
That shifts inspection from one-off missions to always-on corridor coverage. A single BVLOS mission can produce many times the frames of a traditional flight.
The vendor accuracy contest
So the picture in 2026 is three forces pulling against each other:
- A large, aging asset base where the highest-load lines are often the oldest.
- An imagery firehose growing as BVLOS and multi-sensor capture expand.
- A vendor conversation fixated on the model: whose accuracy figure is highest, whose interface looks cleanest.
The variable that actually decides what an inspection finds is not in that conversation. It sits upstream, in the photograph.
AI inspection accuracy vs. assessability
Every AI inspection vendor leads with an accuracy number, almost always above 90%. The number is real, and it is the wrong thing to compare on its own, because two different things are being measured:
- Accuracy describes how well a model reads an image it can actually assess.
- Assessability describes whether the image can be judged at all.
The rest of the AI field figured this out years ago.
Andrew Ng, who co-founded Google Brain and now runs Landing AI, has argued for years that most teams over-invest in models and under-invest in data. When he set out to improve a steel-defect detector, tuning the model did nothing, and cleaning up the data lifted accuracy by 16%.
The lab evidence is just as clear. Researchers Dodge and Karam tested four networks against five kinds of image degradation and found they came apart under blur and noise. Vision systems are trained on clean images, then fielded on images that are nothing of the kind.
What is the assessability ceiling?
The assessability ceiling
The share of a defect catalog that a single image can support a verdict on. It is fixed the instant the shutter closes, and nothing downstream lifts it.
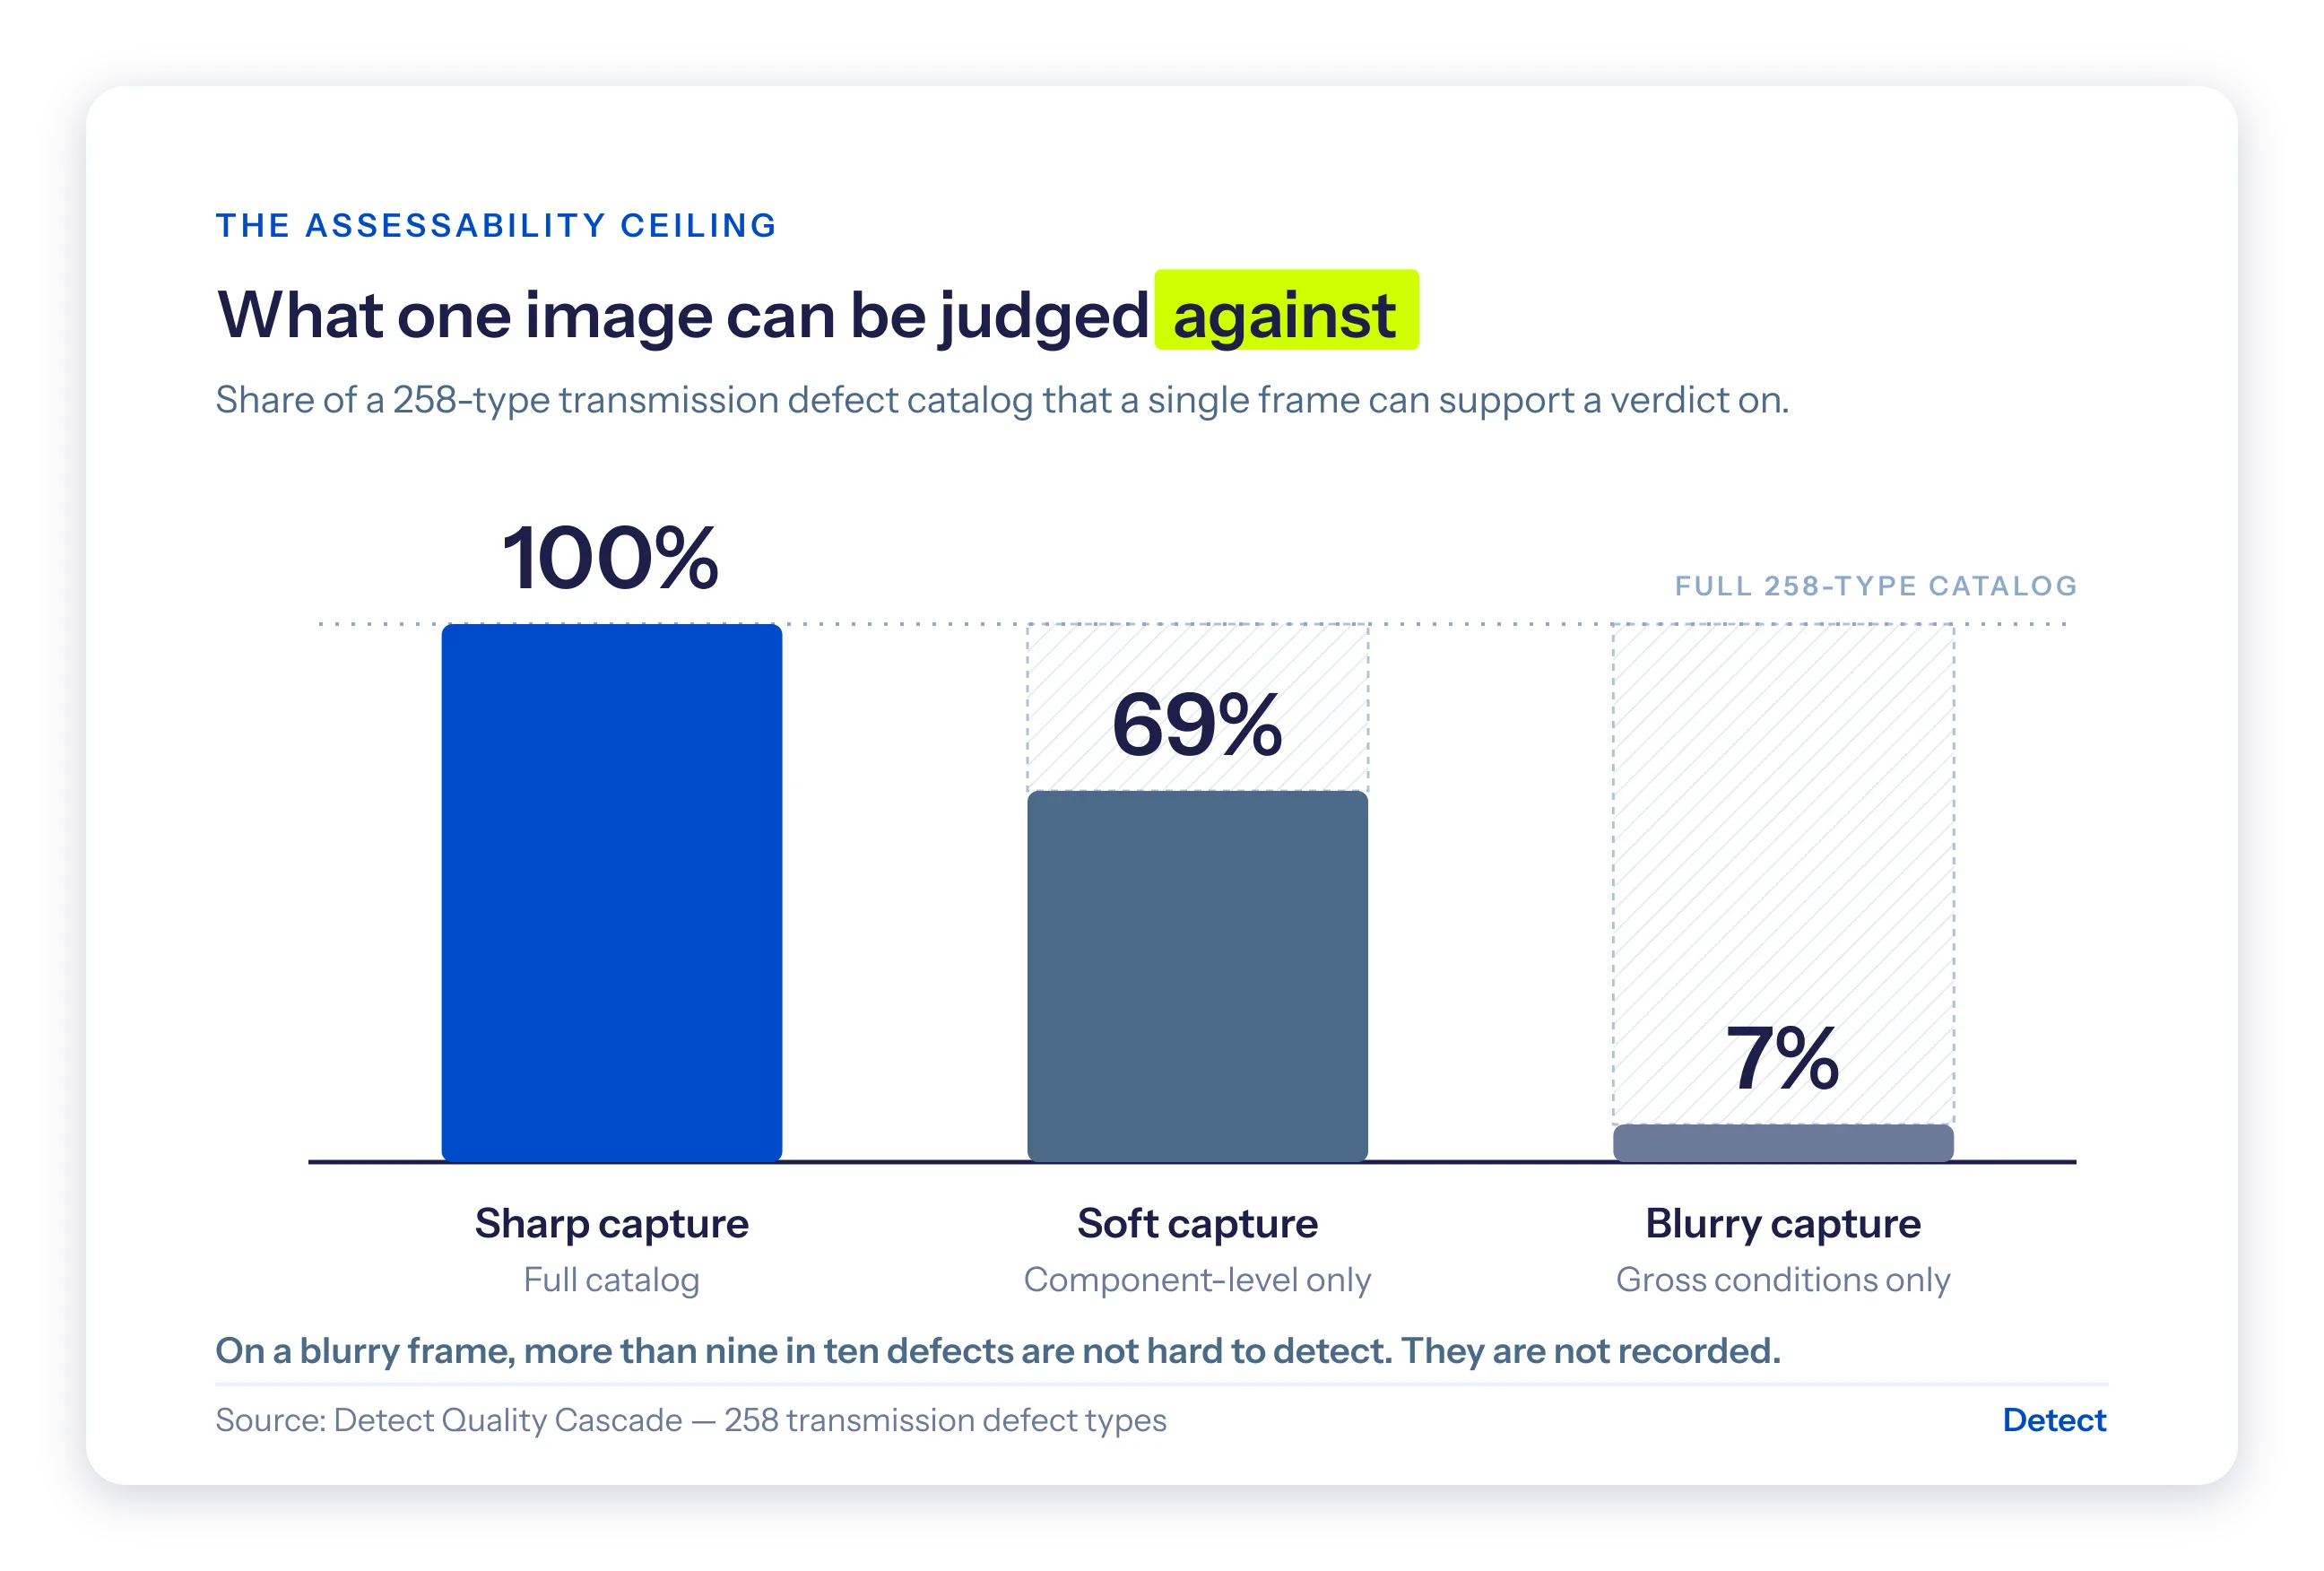
A transmission defect catalog can be deep. Ours runs to 258 distinct types. How many a given frame can be judged against depends entirely on capture quality:
- Sharp capture: the full catalog is assessable. 100%.
- Soft capture: component-level conditions only. About 69%.
- Blurry capture: gross conditions only. Around 7%.
On a blurry frame, more than nine in ten of the defects you are paying to find are not hard to detect. They are invisible. The information was never recorded.
An inspection image is a measurement, and like any measurement it has a resolution. No engineer trusts a micrometer reading without knowing the tool's precision.
The same image, asked to certify a power line, is handed that trust by default.
Inspection data quality: the three foundations before defect detection
The ceiling is the most visible data problem, but not the only one.
A sharp image is still useless if it is tied to the wrong structure or cannot be compared to last year's. This is the heart of why utilities stall on AI inspection platforms: the obstacles sit beneath the model, in the data. Three foundations have to hold first.
- Photo-to-structure association. Field GPS is wrong a surprising share of the time. If an image cannot be reliably mapped to the right structure, a defect found on the correct tower becomes a work order sent to the wrong one. Reliable association uses visual recognition and spatial analysis, not GPS alone.
- Orientation tracking. A photo is only useful if you know which component it shows and from what angle. Tracking position and viewing angle makes findings comparable across crews and over time, turning a one-off inspection into a condition history you can trend.
- Image quality grading. The assessability check itself: scoring every frame for sharpness and effective resolution before any defect model runs, and flagging poor captures rather than burying them.
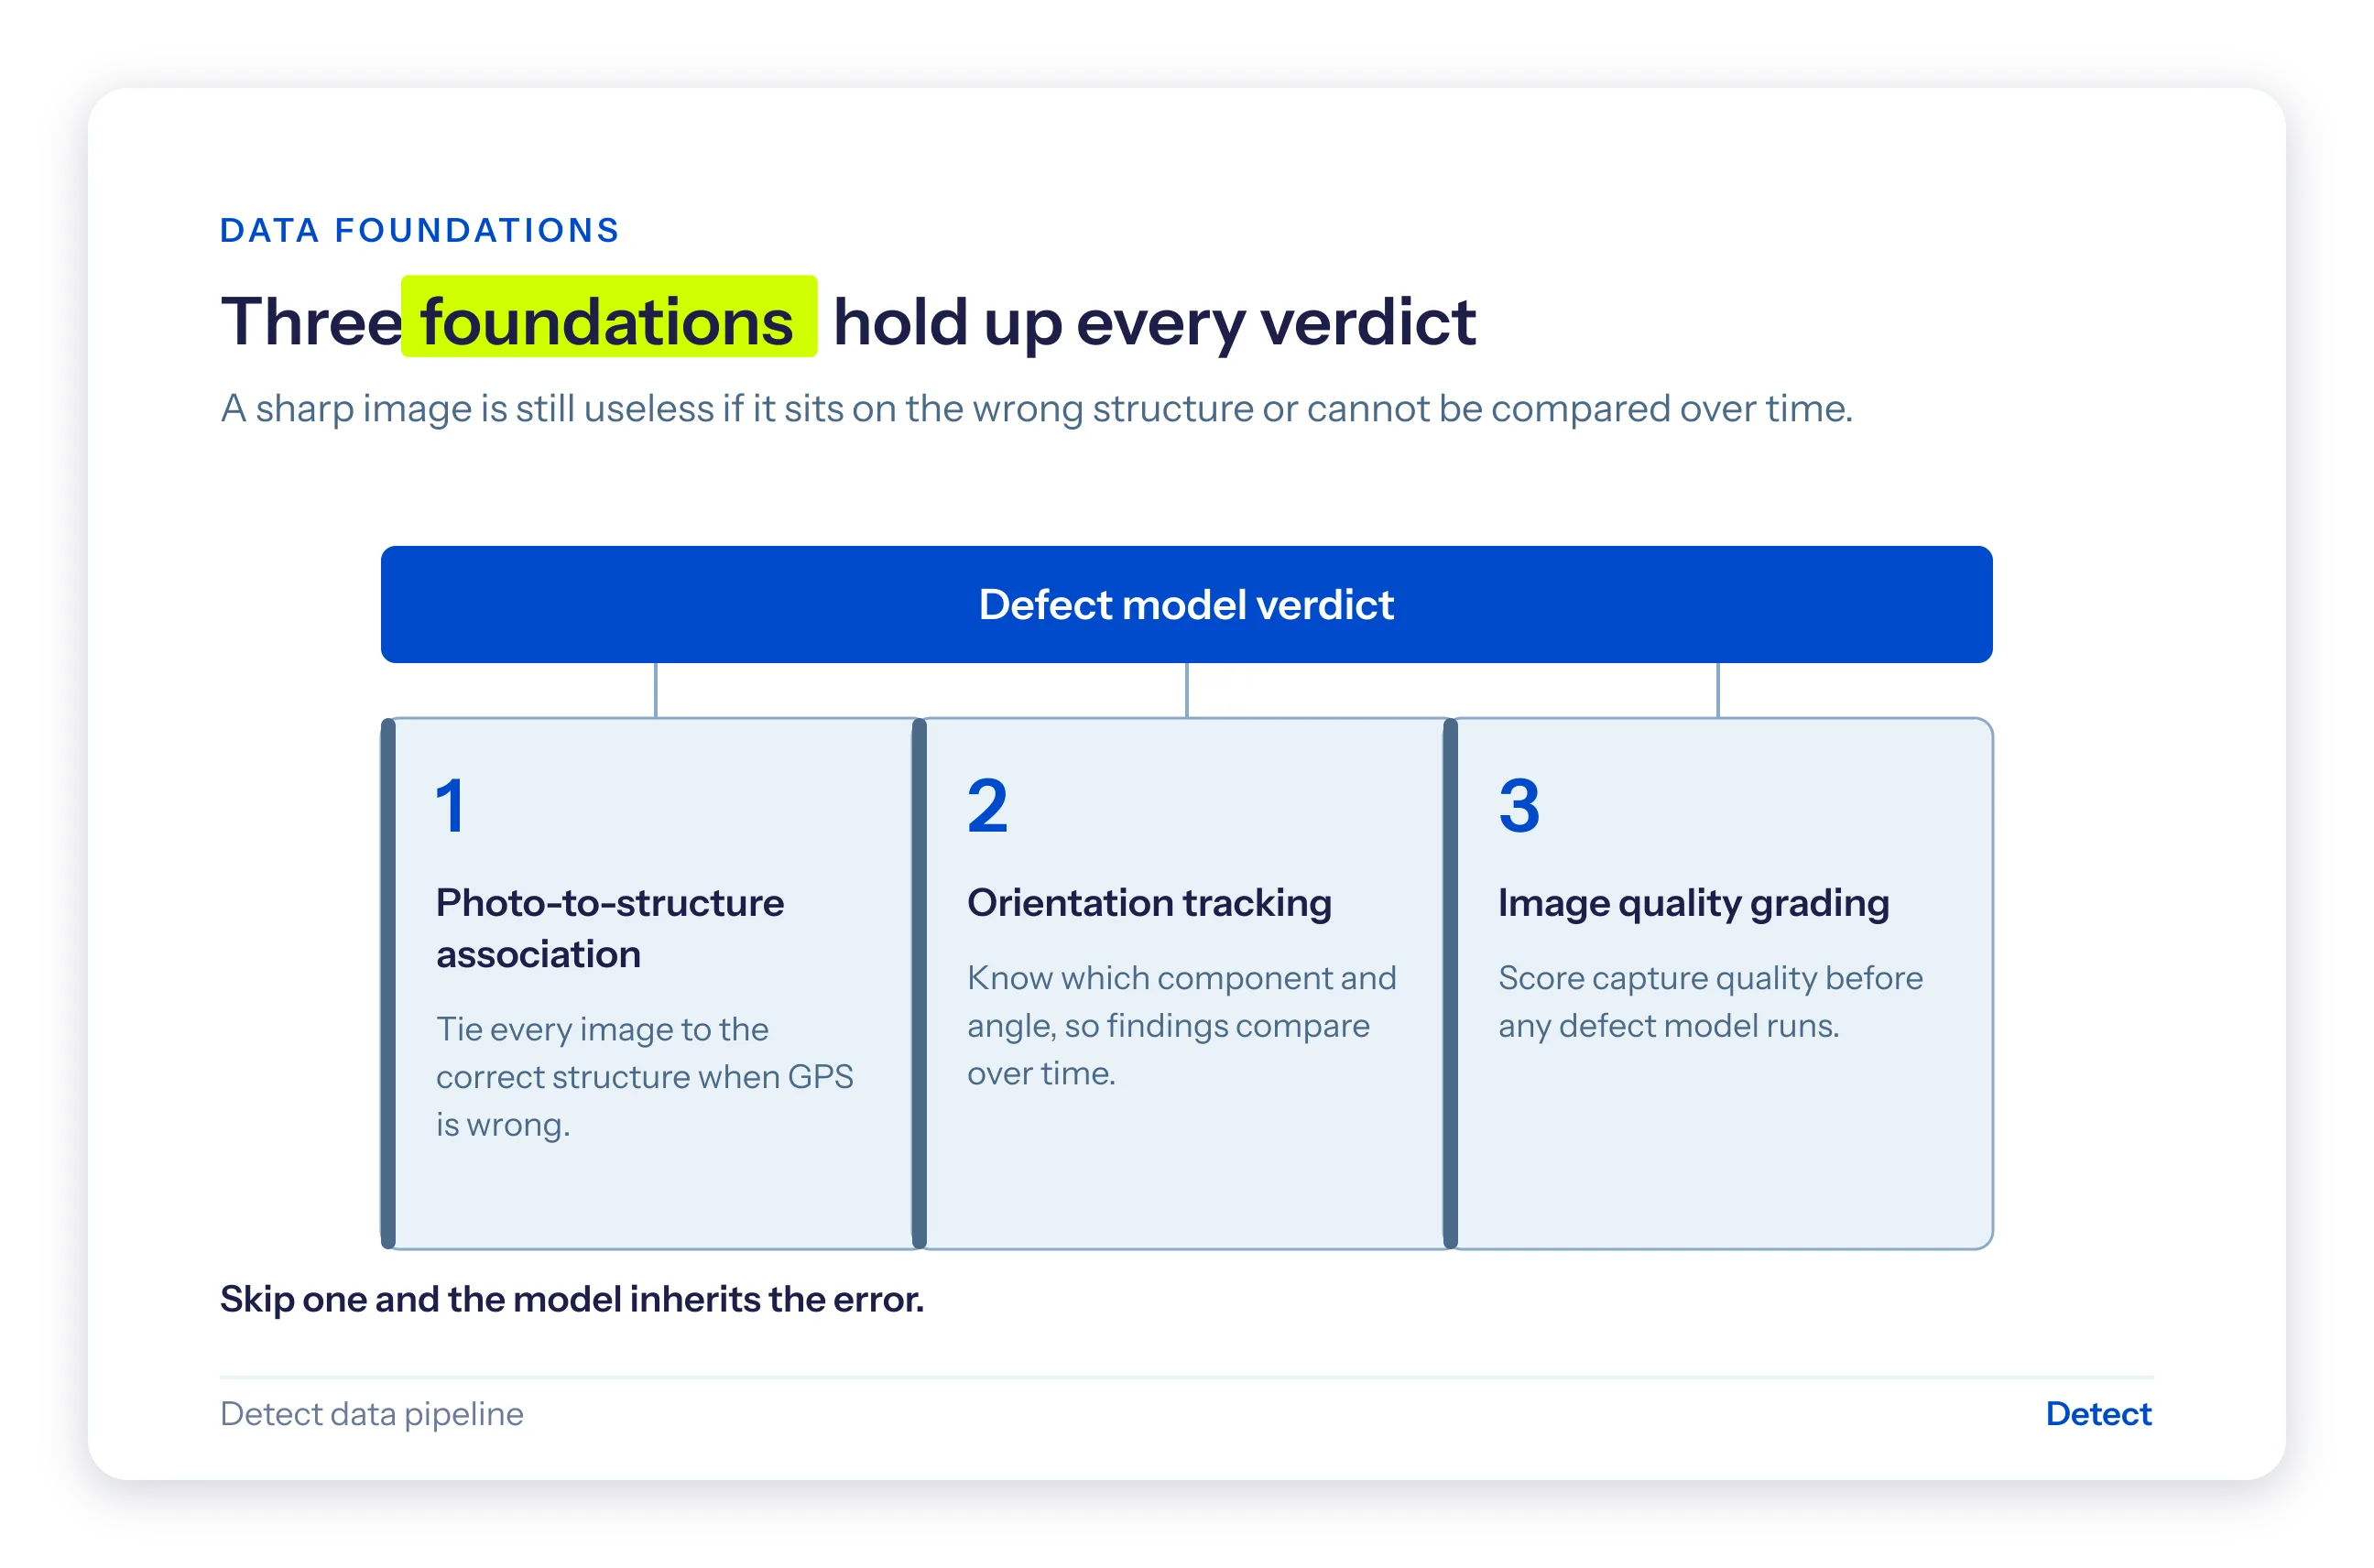
Run in that order, the three foundations separate raw inspection data from asset condition intelligence. Skip one and the model inherits the error.
Image resolution and defect detection: why GSD sets the limit
The reason capture quality caps the catalog is physical, and it has an industry metric: Ground Sample Distance (GSD), the real-world distance each pixel represents.
GSD is the cleanest way to understand detectability:
- At 1 cm per pixel, a crack two centimeters wide spans two pixels and is clearly visible.
- At 5 cm per pixel, that same crack falls inside a single pixel and may not be detectable at all.
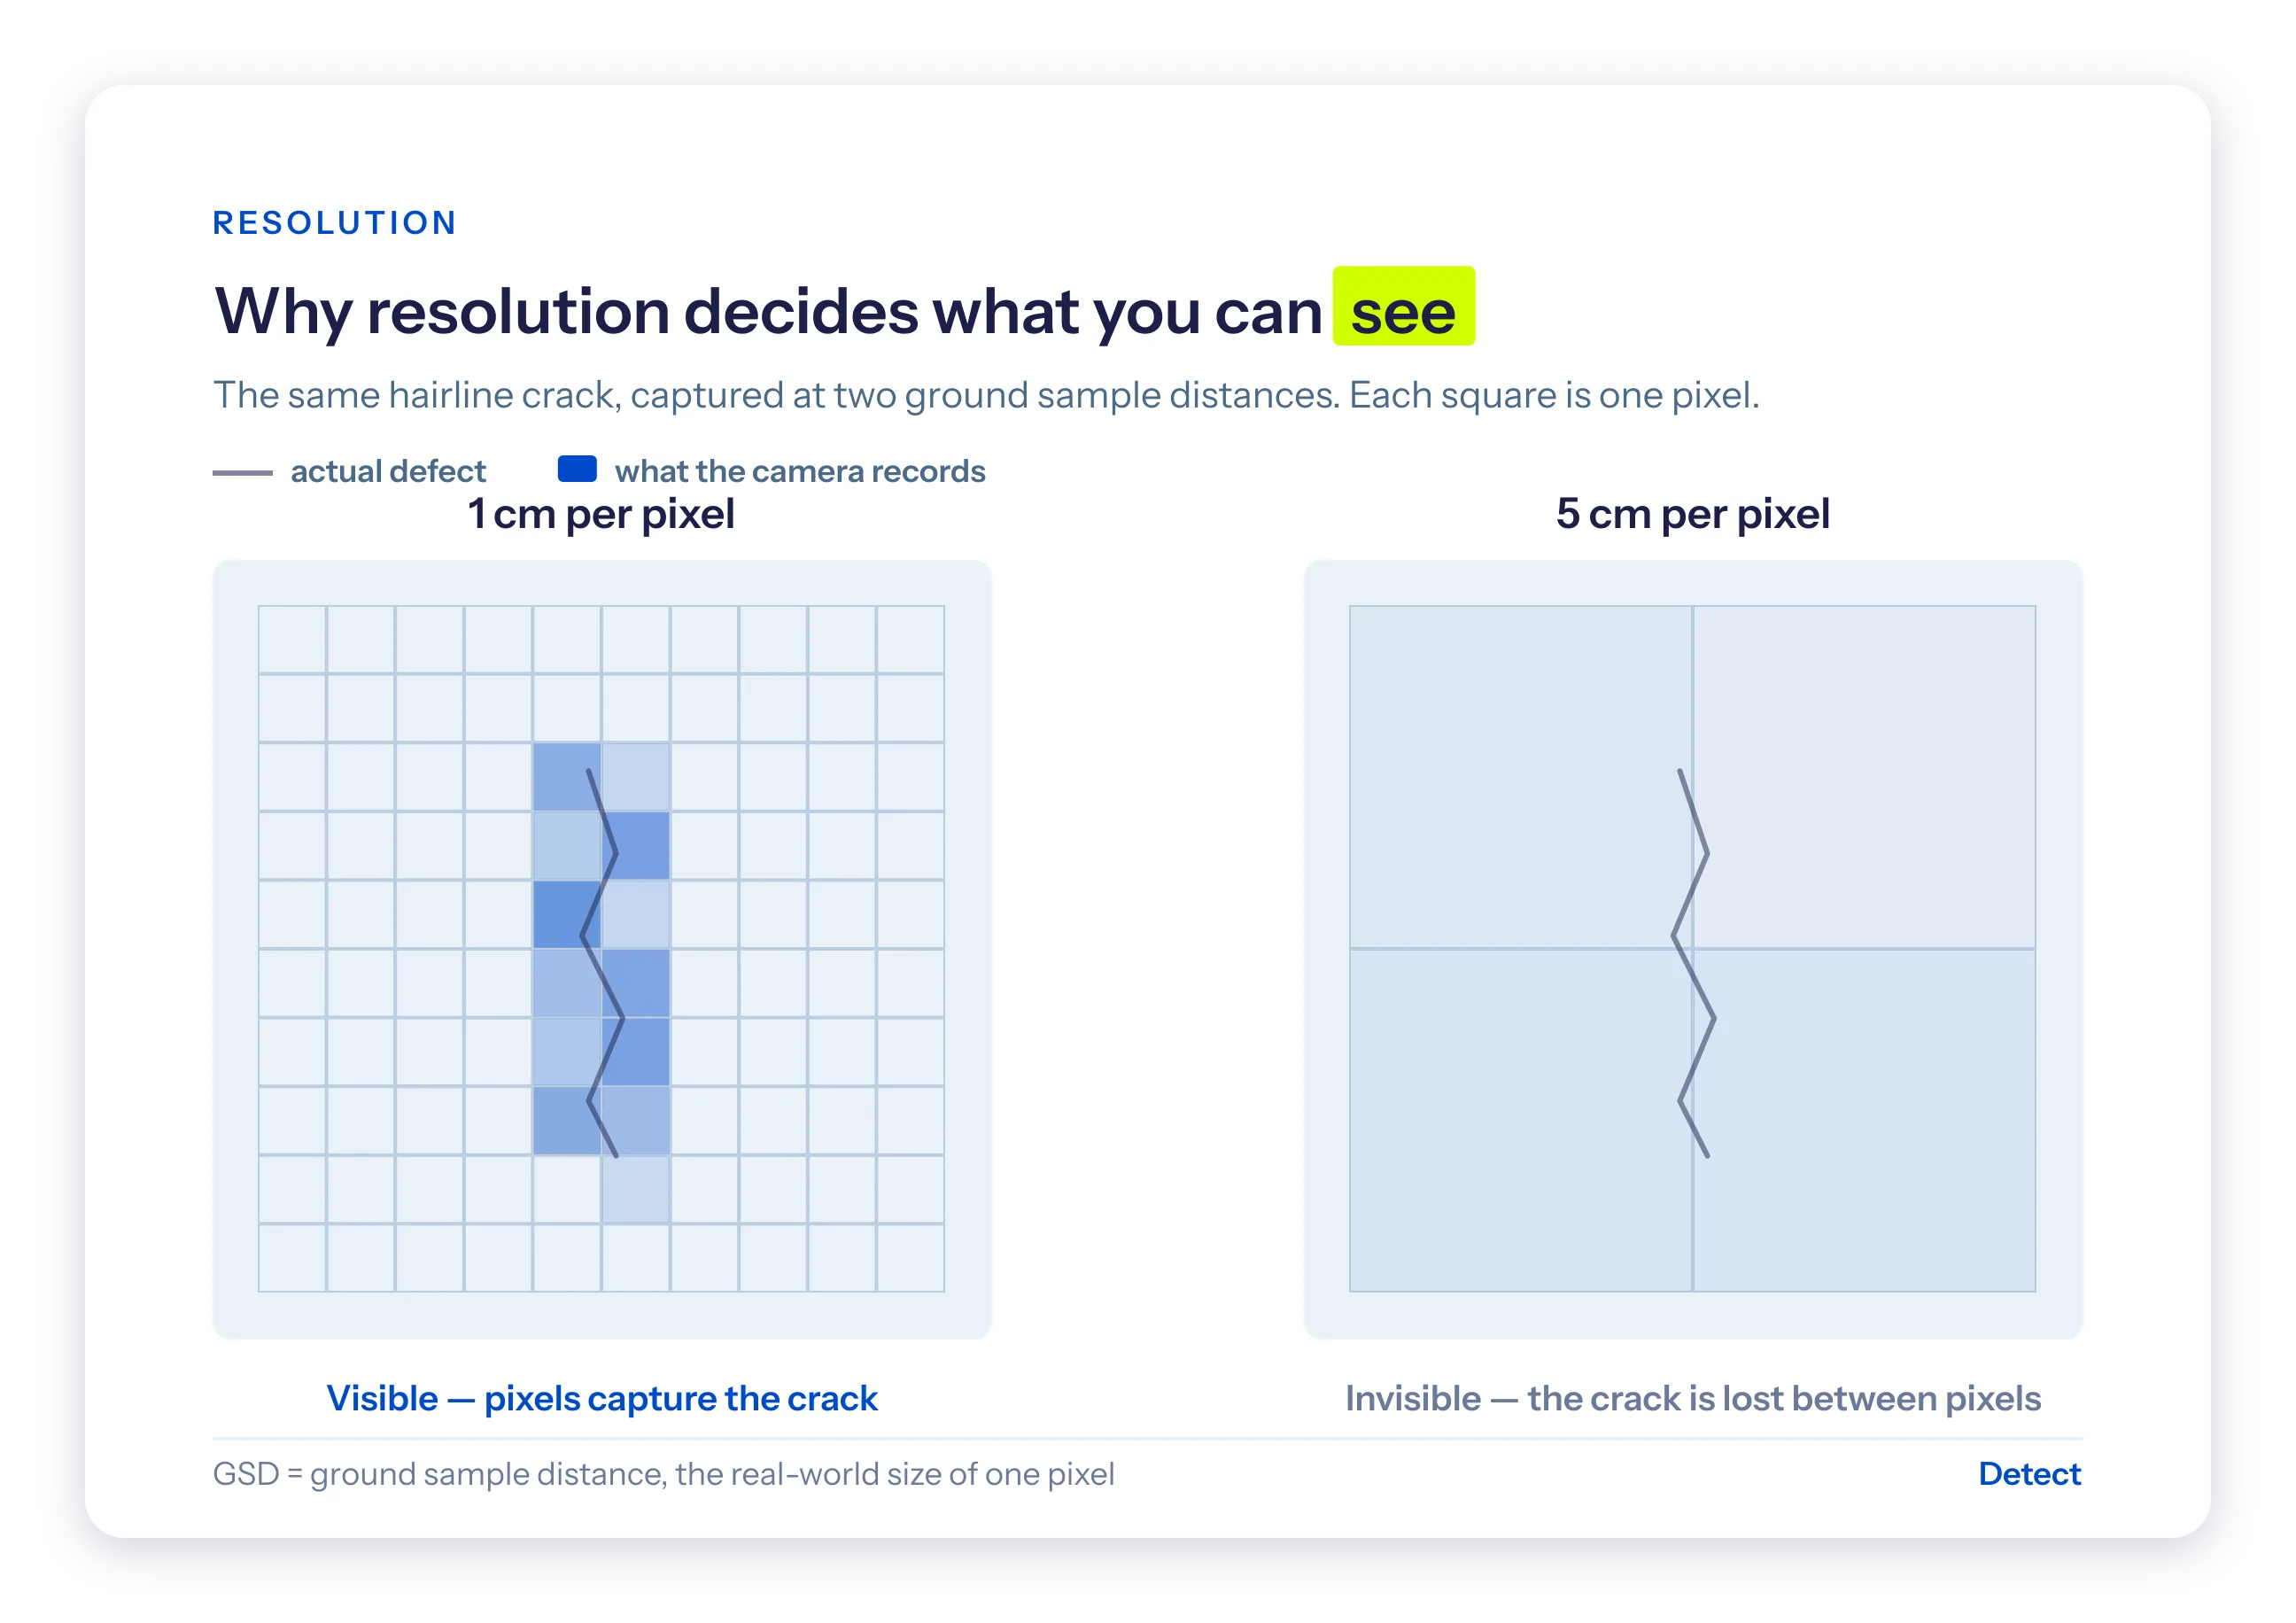
Sub-centimeter GSD is the working standard for serious infrastructure inspection. And GSD scales with distance: double the standoff between camera and conductor, and you double the GSD, halving your resolution.
Research on aerial object detection confirms that detection accuracy is bounded by GSD, with smaller objects needing finer resolution to be found at all.
How much resolution do you need to see a defect?
It depends entirely on the size of the defect, and the defects that matter are small. A cotter key is a few centimeters of metal. A hairline crack in an insulator skirt is a fraction of that.
Photographed from a helicopter moving along a corridor at standoff distance, in variable light, those features can occupy a handful of pixels.
At that scale, the difference between a sharp frame and a soft one is the difference between a verdict and a guess. The model never gets a vote, because the evidence was never resolved.
Why AI misses small defects on power lines
Here is the cruel geometry of the ceiling. The conditions that drop conductors and start fires are small features on a very large structure:
- A loose or missing cotter key.
- A cracked insulator skirt.
- A worn fitting or hanger plate.
Small objects are among the hardest things in computer vision to detect. This is not a Detect position.
A peer-reviewed review of vision-based power line inspection names the field's two great unsolved problems as data quality and small-object detection, in that order. Other reviews single out bolt-level hardware as the toughest target of all.
It is also why so many programs catch the wrong things, flagging the obvious conditions and missing the small, load-bearing ones. That is the core argument for reading power grid failure causes through a reliability lens.
The defect most likely to cause a catastrophe is the one the camera is least able to resolve. As capture quality slips, it goes first.
That is why "95% accurate" and "missed the bolt that dropped the conductor" are not a contradiction. The model can be accurate on what it can see. The fastener it never resolved was never on the table.
Why manual QA can't scale with drone inspection volume
If poor captures are the disease, manual quality control is the failed cure. It does not scale, and it happens too late.
- The bottleneck is review, not flight. It sits in the weeks of human review after the drone lands, which is exactly where the cost hides when you try to inspect 10x more assets without hiring 10x the crew. BVLOS makes it worse by multiplying frames.
- Late catches are expensive. A blurry capture caught a week after demobilization is a return trip and a reflight, not a two-minute reshoot.
- The volume is real. By Detect's own accounting, up to 40% of utility inspection imagery is rejected or unusable somewhere in the pipeline, and the data-quality failures behind rework trace back to capture, not fieldwork.
Manual QA cannot find those problems fast enough or consistently enough. Grading has to be automated, and it has to run while the crew is still on site.
What the Camp Fire teaches about inspection data quality
On the morning of November 8, 2018, a C-shaped steel hook on a transmission tower in the Feather River Canyon gave way.
The hook held a jumper cable aloft on the Caribou-Palermo line, a 115-kV circuit carrying power down from a hydroelectric plant built in the 1920s. When it broke, the energized cable swung into the tower and threw sparks into dry brush in high wind.
The fire that followed killed 85 people and erased the town of Paradise. It remains the deadliest wildfire in California history, and the starkest case for why transmission line inspection has to find the small things before they fail.
What investigators found
The hook had been wearing for a very long time. The record is damning:
- FBI metallurgists judged it consistent with having hung for 97 years, the full life of the line.
- More than half the thickness of the metal had ground away where it met the plate.
- The wear went undetected by the company's patrol and inspection program, state safety investigators reported, and crews had not climbed that tower for a close look since at least 2001.
- Inspectors later testified they could not have seen the wear from the method they used. Even the photographs the utility held did not show the failing hook clearly enough to judge it.
The defect was real. It had been there for decades. The capture could not see it.
That is the assessability ceiling in its most expensive form.
The regulator concluded the hook's timely replacement could have prevented the fire's ignition. A clearer view of one small piece of hardware, on one tower among thousands, stood between a routine repair and 85 deaths.
The inspection did not miss because no one looked. It missed because what they looked at could not answer the question.
False negatives in AI inspection: the silent failure
The most dangerous image in any inspection is not the one flagged as bad. It is the one too poor to assess that comes back marked "no defect found."
A false negative does not raise its hand. It reads as a pass and goes in the file.
That label is indistinguishable from a real all-clear.
In 2021, a Google Research study gave this failure a name: data cascades, the compounding downstream harms that begin with a quiet data problem and surface much later as something worse.
The researchers found data cascades in 92% of the high-stakes AI projects they studied, and described them as invisible and delayed by nature. Their summary of the cause was unsparing: everyone wants to do the model work, not the data work.
One example reads like a parable for grid inspection. A model that detected eye disease, trained on pristine images, worked in the lab and then failed in the clinic on photographs marred by small specks of dust.
Trade the clinic for a transmission corridor and the dust for motion blur, and it is the same story, with a town downstream.
Condition-based vs. calendar-based inspection: inspect by risk
The stakes are not only safety. They are increasingly regulatory and financial, which is why capture quality has become a board-level concern, not a field detail.
Since 2018, the Western wildfire regime has run on a set of frameworks now common across the industry:
- High Fire-Threat District (HFTD) maps that tier wildfire risk into three levels.
- Wildfire Mitigation Plans (WMPs), the annual filings utilities submit to document risk reduction.
- Public Safety Power Shutoffs (PSPS) and Enhanced Powerline Safety Settings (EPSS), operational controls that de-energize or trip lines faster in extreme conditions.
Risk in these systems is heavily concentrated.
Just 90 circuit segments carry the top 20% of PG&E's wildfire risk.
That concentration is the argument for condition-based inspection over the calendar-based cycles that drive the cost of reactive maintenance.
If a small share of the system carries most of the danger, inspecting every mile on the same cycle wastes effort on low-risk assets and under-serves the ones that can start a fire. The alternative is to rank what crews fix by severity and component criticality the day imagery is captured, which is what same-day AI triage is built to do.
And it only works if the data underneath is trustworthy. In a high fire-threat corridor every captured image is potential evidence, defensible to a regulator, an underwriter, and a court.
The cost of missed defects in utility inspection
The economics follow the same logic. Consider one suspension-hardware fault:
- Caught while you are still planning the work, the repair runs about $15,000.
- Caught later, under warranty conditions, it is nearer $150,000.
- Missed until the part fails in service, the figure is closer to $750,000, before the outage.
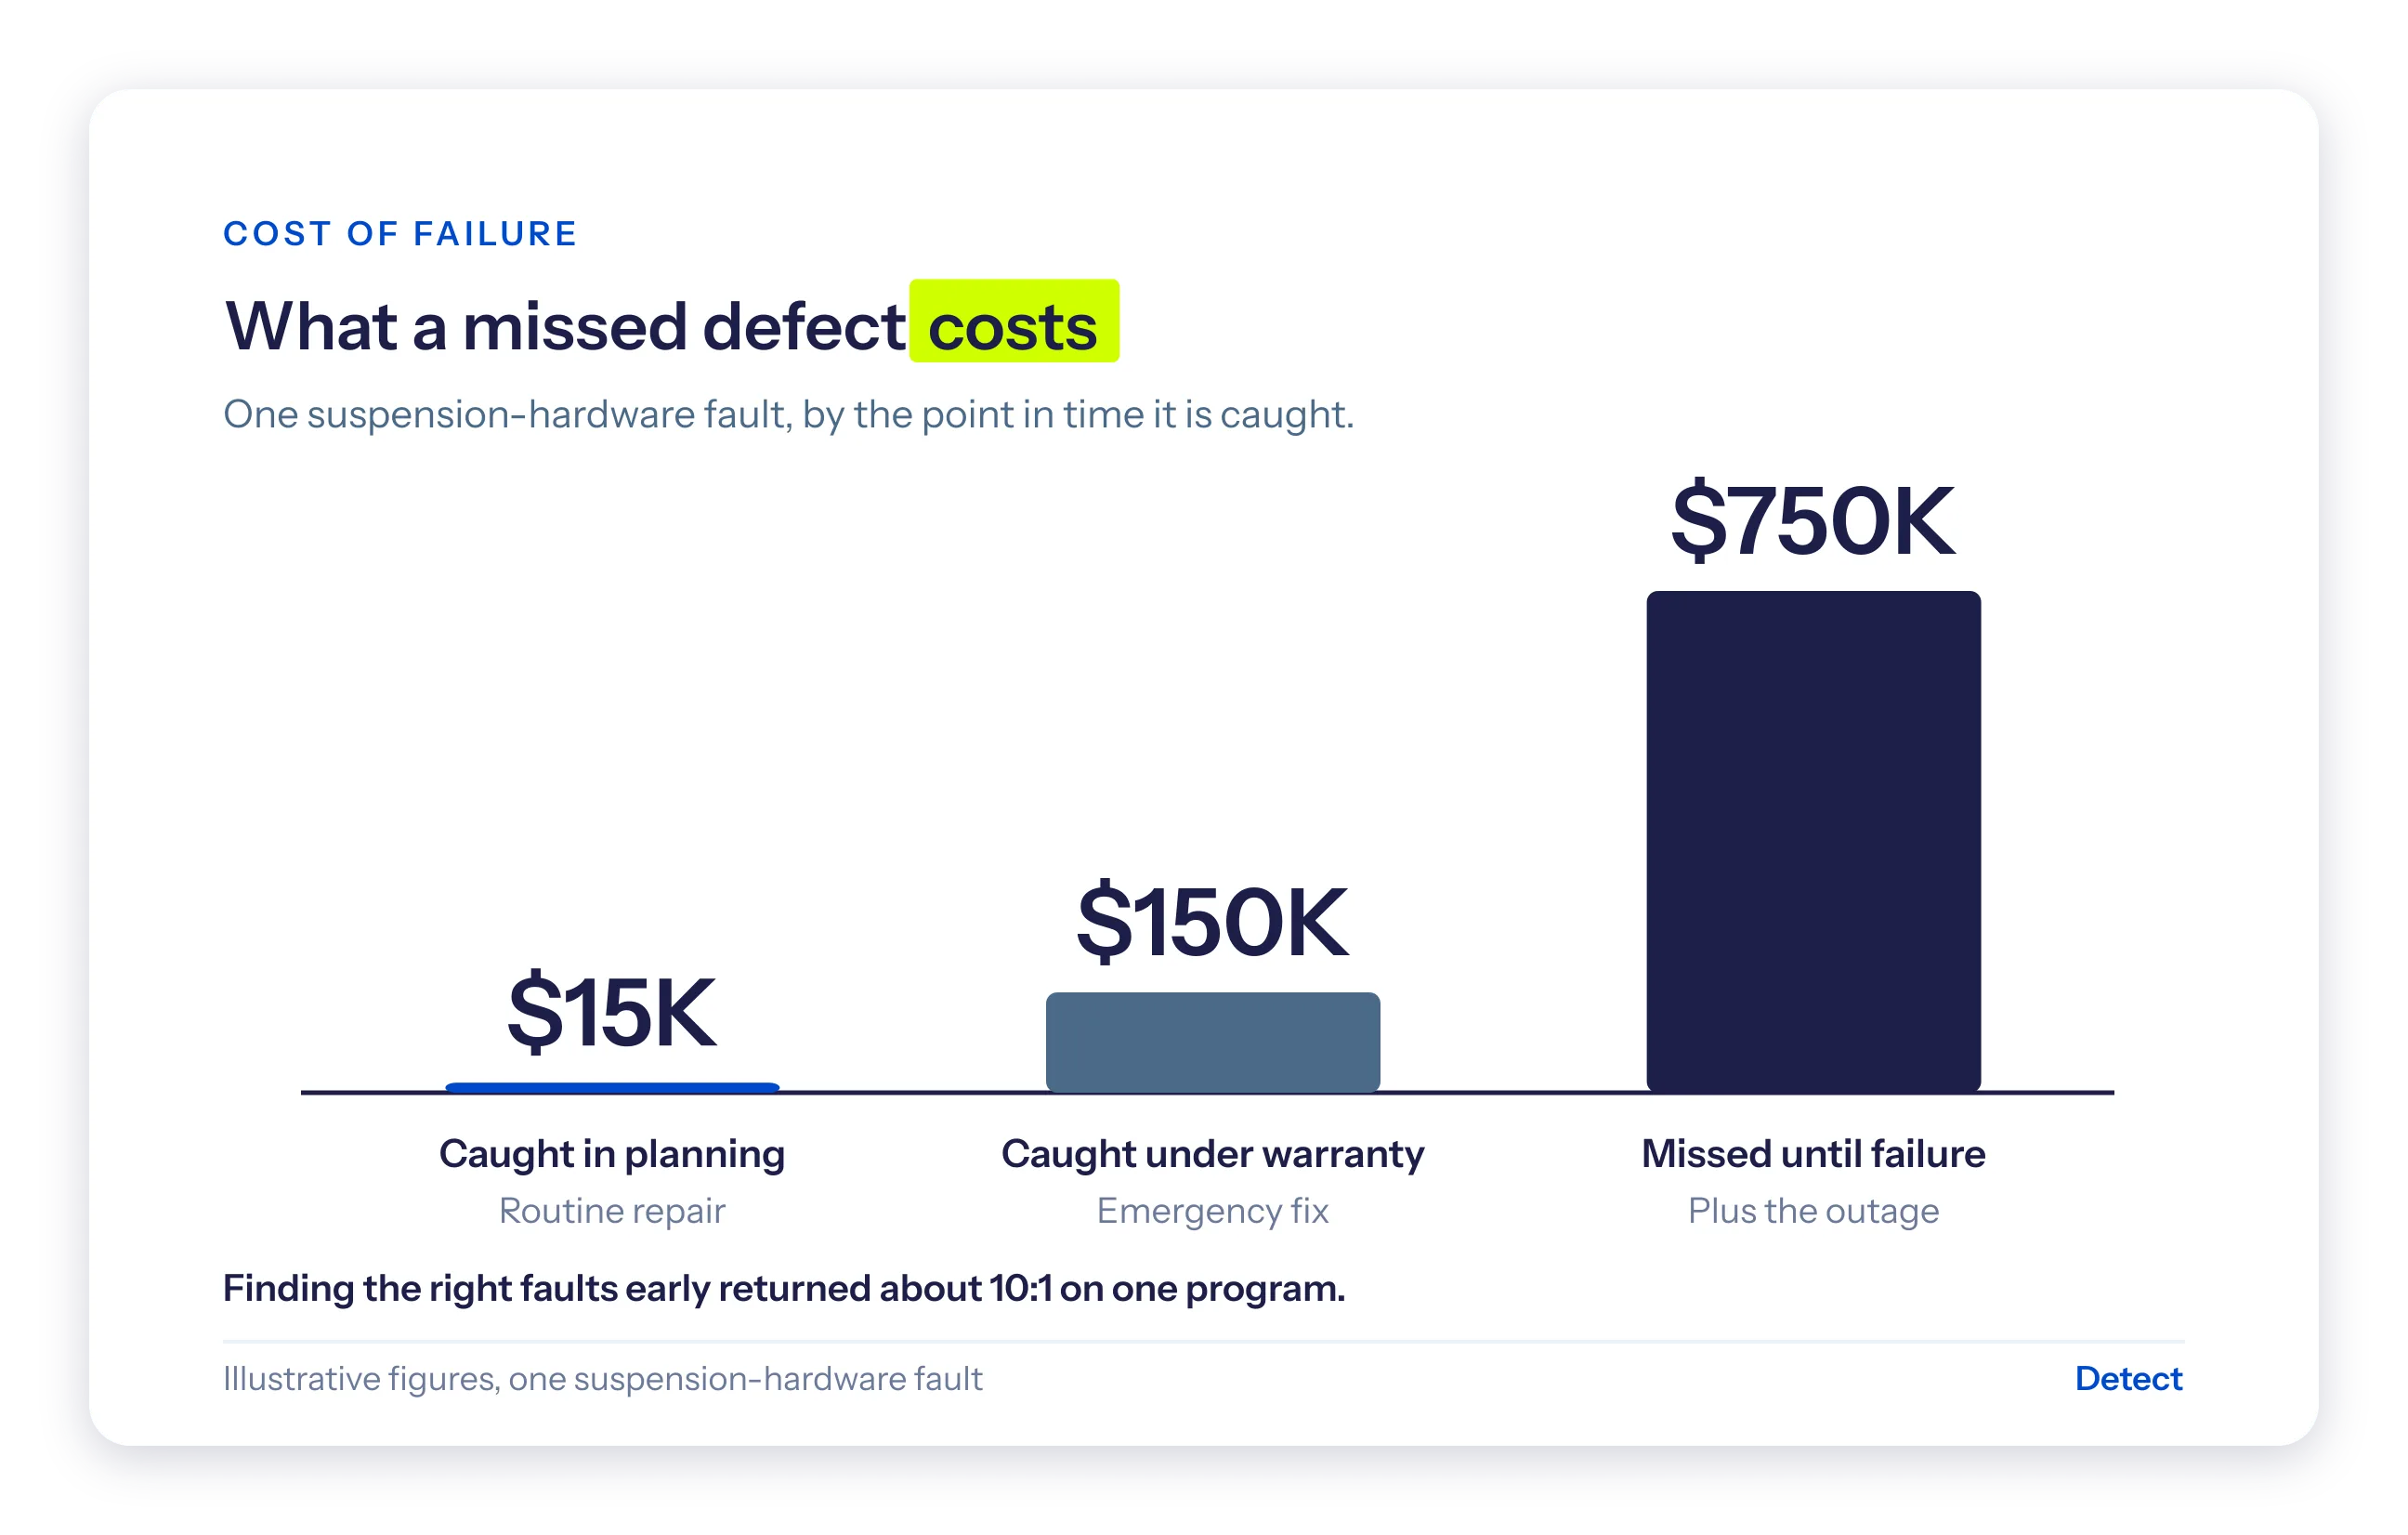
On one program, finding the right faults early returned about ten dollars for every dollar spent. Most of that value is lost upstream, because 15 to 25% of imagery needs rework before a model can use it at all.
And outages are cheap to no one. An Oak Ridge analysis put the average annual cost of major U.S. power outages near $67 billion across 2018 to 2024, and at $121 billion in 2024 alone.
Every one of those numbers sits downstream of whether a defect was visible in the first place.
Transmission, distribution, and substation inspection
The assessability ceiling is not a transmission-only problem. It holds anywhere a model is asked to judge an image of grid hardware:
- Transmission. The high-voltage backbone, where a single failure can cascade and fittings like the Camp Fire hook are small, high-consequence targets. See transmission inspection.
- Distribution. The last-mile network behind most customer outages, with millions of poles and crossarms to assess at scale. See distribution inspection.
- Substations. Dense concentrations of equipment where component-level resolution and thermal capture matter most. See substation monitoring.
Across all three, the principle is identical. The model is only as good as the picture, and the picture is set in the field.
How to improve AI inspection accuracy: grade the image first
The fix is not a better model. It is checking the input before the model is allowed to speak.
The discipline is easy to describe and rare to practice. It is the foundation DetectOS is built on:
- Grade every image first. Score sharpness and effective resolution before any defect model runs. Analyze what is assessable, and flag the rest by exception.
- Treat capture quality as a measured property, not an article of faith. Every verdict should carry a quantified, reviewable basis.
- Keep a human behind the call. AI does the volume. Domain experts validate findings so each one is defensible to a regulator or a board.
- Tie every finding to a structure and component. Without reliable association and orientation, a defect lands on the wrong tower and so do the crews.
- Set the standard before the prop spins. Calibrating capture to a utility's requirements up front is the premise of the Data Quality Program: deliverables accepted on the first pass, not reflown.
How to evaluate an AI utility inspection platform
When you compare platforms, the defect model is the last question, not the first. Ask these in order:
- What share of your imagery can the model actually assess, and do you grade capture quality before analysis?
- How do you tie each photo to the correct structure when GPS is wrong?
- Are findings comparable across crews and over time, so a structure's condition can be trended?
- Is capture quality confirmed in the field, while a reshoot is free, or weeks later?
- Does a domain expert stand behind each verdict, with a basis you could defend?
- What is your rework or rejection rate, stated as a percentage from recent campaigns?
A platform that leads with the model and goes quiet on the first five is asking you to trust an output without trusting the input.
Done right, a report means what it says. "No defect found" tells you the image could support that verdict. Skip the step, and "no defect found" and "the picture was too poor to tell" arrive wearing the same words, and only one of them is true. Knowing which is the entire job.
Babbage could not apprehend how anyone might expect right answers from wrong figures. The machines have changed beyond his imagining. The confusion has not. A defect model cannot make a sound verdict from a picture that never held the defect, and no accuracy number on a slide can paper over it.
Before the model, before the score, before the clean report, one question still decides everything: was the picture good enough to see what you needed to see?
Measure your inspection data quality
The fastest way to find your assessability ceiling is to measure it.
Detect will run a free analysis on a representative section of your system and show you what share of the imagery is decision-grade, and what an autonomous read catches before it becomes a failure.
Frequently asked questions about AI inspection accuracy
Does image quality affect AI defect detection?
Yes, and it is one of the most established findings in computer vision. Controlled studies show neural networks lose accuracy under blur and noise, and aerial detection accuracy is bounded by Ground Sample Distance. The share of a defect catalog an image can be judged against falls sharply as capture quality declines, so the model's ceiling is set at capture.
Why do AI inspections sometimes miss critical defects?
Usually because the capture could not resolve the defect, not because the model failed. Reliability-critical conditions like loose fasteners are small features, and small objects are the hardest for vision models to detect. On a soft or blurry image those defects are not recorded, so no model can recover them.
How accurate is AI for utility inspection?
Accuracy figures above 90% are common, but the number describes how well a model reads an assessable image, not whether the image is assessable. A more useful question for any vendor is what share of their imagery can support a verdict, and whether they grade capture quality before analysis.
What resolution is needed for drone inspection of power lines?
Sub-centimeter Ground Sample Distance is the working standard for component-level inspection, because the defects that matter are small. A feature must span at least a couple of pixels to be reliably detected, and GSD worsens as the camera's standoff distance from the asset increases.
How do you reduce the risk of missed defects in AI inspection?
Grade every image for capture quality before analysis, capture to a resolution standard that keeps small components resolvable, tie each finding to the right structure, and validate verdicts with domain experts. This is the data-centric approach applied to grid imagery.
Related reading: expert-verified AI asset inspection
