
What Causes Power Outages? Grid Failure Causes and How Utilities Catch Them Early
Most inspection programs are optimized to catch the failures that don't cause outages. This is a guide to finding the ones that do.
Updated September 2026
The short answer: Weather triggers most power outages - about 80% of U.S. customer outage hours in 2024 came from major weather events (EIA, December 2025) - but the causes underneath are aging hardware, hidden corrosion, vegetation contact, and equipment defects that develop between inspection cycles. Reliability-centered maintenance closes that gap by ranking structures by risk and matching each failure mode to condition-based, time-based, or deliberate run-to-failure work.
The conductor that failed last winter had been failing for three years.
Inside the aluminum strands, the steel core had been corroding since a wet spring three springs ago. Slowly. Out of sight. By the time it let go in an ice storm, the line had been patrolled four times and flown twice. Every inspection passed. None of them could have caught it. The damage was under the aluminum, in the one place a camera and a pair of eyes on the ground were never going to reach.
That conductor didn't fail because your crew missed something. It failed because your inspection program was never built to find it. And that gap - between what your program can see and what is actually going to fail - is where transmission outages come from.
This guide breaks down why manual inspections miss the failure modes that matter, what actually drives power grid failures, and how reliability-centered maintenance (RCM) closes the gap with risk-based work plans, smarter preventive strategies, and faster detection.
Key takeaways
- Weather triggers most transmission outages, but aging, undetected hardware is the underlying cause - and U.S. outages cost customers an estimated $121 billion in 2024.
- Many transmission failure modes are physically invisible to manual inspection, and inspection cycles run far slower than failures develop.
- RCM matches each failure mode to the right work - condition-based, time-based, or run-to-failure - instead of inspecting everything on the same calendar.
- Condition-based programs typically cut unplanned downtime by 30 to 50 percent, while reactive maintenance costs three to five times preventive work.
- The costliest failures develop between inspection cycles. On one new ~250-mile HVDC intertie, a single backed-off clevis bolt - caught between commissioning and the first winter peak - averted $1M+ in forced-outage revenue (Detect Data Quality Program, 2026).
Why does the power go out?
The power goes out when something in the delivery path - a line, a pole, a transformer, a connector - stops carrying load, and in the United States the trigger is usually weather. In 2024 the average customer was without power for about 11 hours over the year, and roughly 80% of that time came from major weather events (EIA, Today in Energy, December 2025). Ranked by how often they bite, the causes of power outages are:
- Severe weather. Wind, ice, lightning, and heat - the trigger in most sustained outages, and the one everybody sees.
- Aging or defective hardware. Corroded conductors, degrading insulators, loose connectors, end-of-life transformers. Roughly 70% of U.S. transmission lines are more than 25 years old (U.S. Department of Energy, Quadrennial Technology Review). Weather finds the weak point; the weak point was already there.
- Vegetation contact. Trees growing into clearance or falling into lines - the cause behind the 2003 Northeast blackout, per the U.S.-Canada Power System Outage Task Force (2004).
- Wildlife, vehicles, and people. Animal contact, vehicle strikes on poles, and dig-ins on underground cable.
- Demand outrunning capacity. Load that exceeds what an aging asset can carry, most often during heat waves and cold snaps.
Only the first cause is visible from the sidewalk. The other four are grid failure causes that develop out of sight, between inspection visits - and that is what the rest of this guide is about.
Power grid failure causes: weather gets the blame, hardware does the damage
You can't prioritize maintenance until you're honest about how the system actually fails. The power grid failure causes that matter most for transmission leaders stack up in four layers.
Weather is the trigger, not the cause
Weather is the largest single driver of transmission outages. In 2024 it affected more than six times the capacity of any other cause in NERC's data, and roughly 80 percent of major U.S. outages from 2000 to 2023 were weather-related. But a storm only drops a line that was already weak. The wind is what people see. The corrosion was there months earlier.
Aging hardware is the amplifier
A storm turns into a sustained outage when it meets a structure near the end of its life. The American Society of Civil Engineers downgraded U.S. energy infrastructure to a D+ in 2025, and the Department of Energy has long put roughly 70 percent of U.S. transmission lines at more than 25 years old. The replacement math is brutal: when a large power transformer fails today, lead times run 80 to 210 weeks. Miss one transformer defect and it can mean two years without the asset.
Vegetation, equipment, and wildfire: the causes that hide between cycles
Beneath weather and age sit the failure modes that build quietly:
- Vegetation contact remains a persistent cause, and much of it falls in a blind spot. Regional data shows the large majority of vegetation-caused outages occur on lines between 100 and 199 kV - below the threshold where the strictest NERC FAC-003 vegetation rules apply.
- Equipment failure is the slow, expensive category - conductors, splices, insulators, bushings, and breakers degrading over years until a hot day or a storm finishes them.
- Wildfire and extreme heat are now a structural risk, not an edge case. NERC's reliability data shows the number of extreme transmission-stress days climbing year over year as fire and heat seasons lengthen.
Demand is rising faster than the system is rebuilt
More load on older assets accelerates thermal aging, which accelerates failure. Five-year peak load forecasts have climbed from 24 GW to 166 GW in three years, most of it from data centers, and S&P Global projects U.S. data center demand will nearly triple by 2030.
The bottom line on causes: Power grid reliability isn't slipping because of one bad actor. The system is older, the weather is harder, and the load is heavier - all at once. You can't fix the weather. You can change how early you see your own assets weakening.
The limitations of manual asset inspection
Visual inspection is good at exactly one thing: finding what's visible. That sounds too simple to matter until you count how many transmission failure modes are invisible by nature. These are the manual asset inspection limitations that no amount of effort fixes. The three gaps behind them - coverage, latency, and record - are broken down in why manual grid inspections still miss failure risks.
Some failure modes are invisible to the eye
A crew can do everything right and still walk past a failure that hasn't surfaced yet:
- Polymer insulators. A defect inside one that's about to fail electrically shows nothing on the surface. EPRI has been blunt about it: finding it takes an electrical tester in direct contact with the unit.
- ACSR conductor. Steel-core corrosion hides beneath the aluminum strands, exactly like the conductor that opened this guide.
- Transformers. Dielectric breakdown is internal by definition. Nothing on the outside tells you it's coming.
- Connectors. A loose connector looks fine cold. It only shows as a hot spot under load, on a summer afternoon, when no one is pointing a thermal camera at it.
Where a defect hides also depends on the structure type - lattice towers, monopoles, and H-frames each fail in their own places, which shapes the failure list you build in Step 2.
Inspection cycles are slower than failures develop
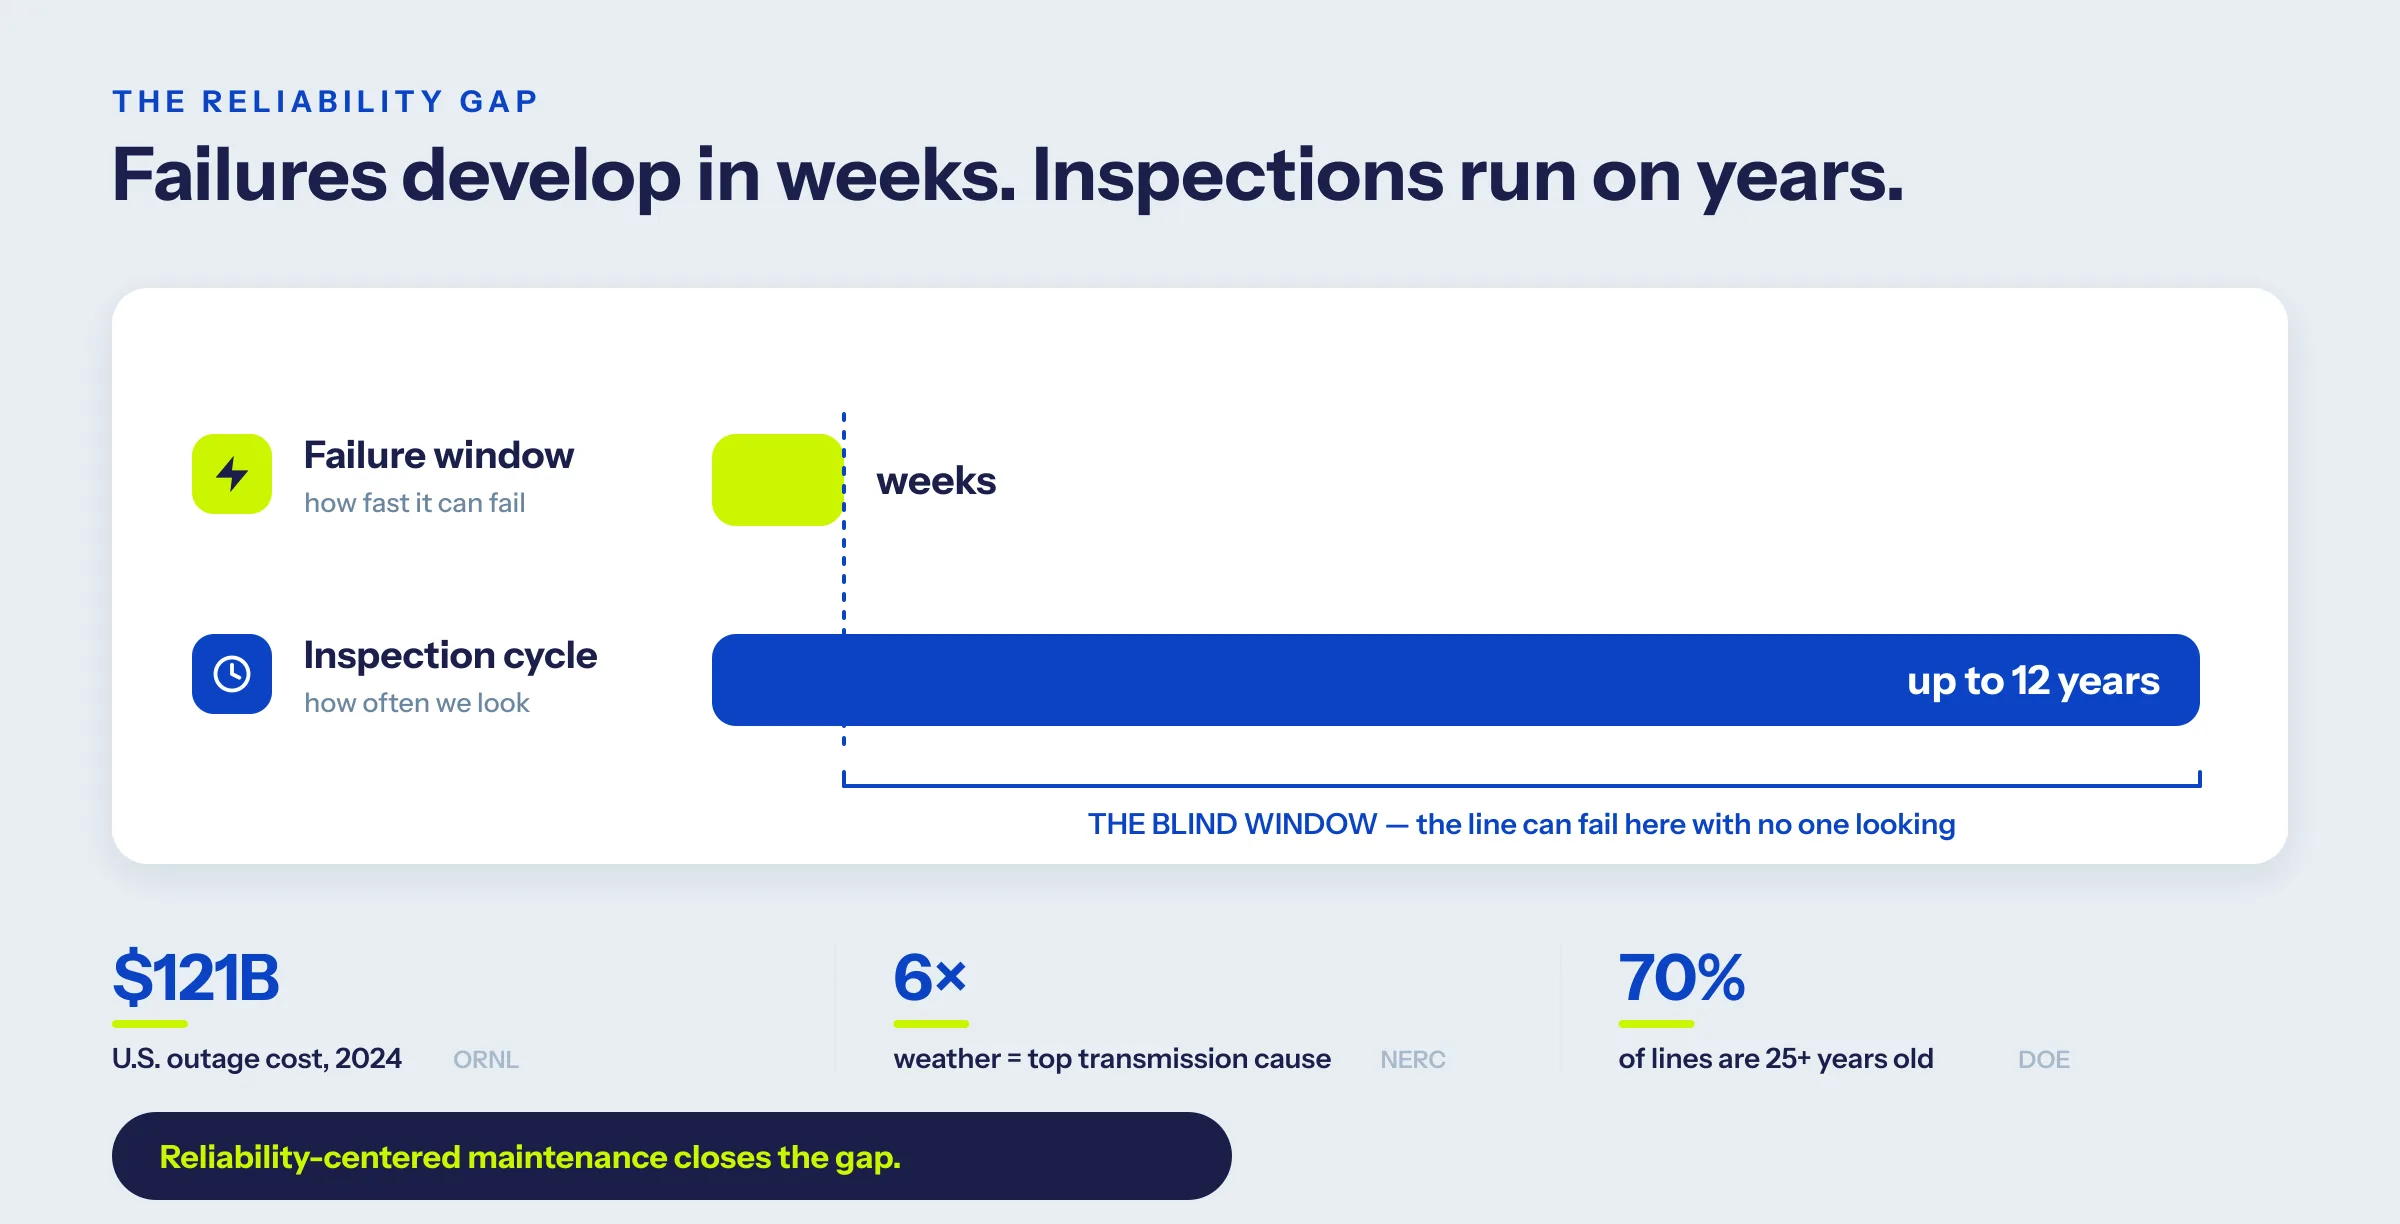
Some of these failures mature in weeks. PG&E's own procedure puts climbing inspections of 500 kV lines on a 12-year cycle in lower-risk areas. Lay a problem that develops in weeks against a cycle measured in years and the surprise isn't that lines fail. It's that more of them don't.
Manual data is inconsistent
Findings vary by crew, by season, and by the angle and quality of the capture. An inspection program built on inconsistent capture quality can't produce reliable trends - and you can't manage a failure mode you can't trend.
The work is dangerous
There's a human cost too. Between 2011 and 2015, line installers and repairers suffered 201 fatal occupational injuries, with electrocution causing nearly half. Every climbing inspection and low-altitude flyover is an exposure that belongs in the maintenance conversation, not just the safety report.
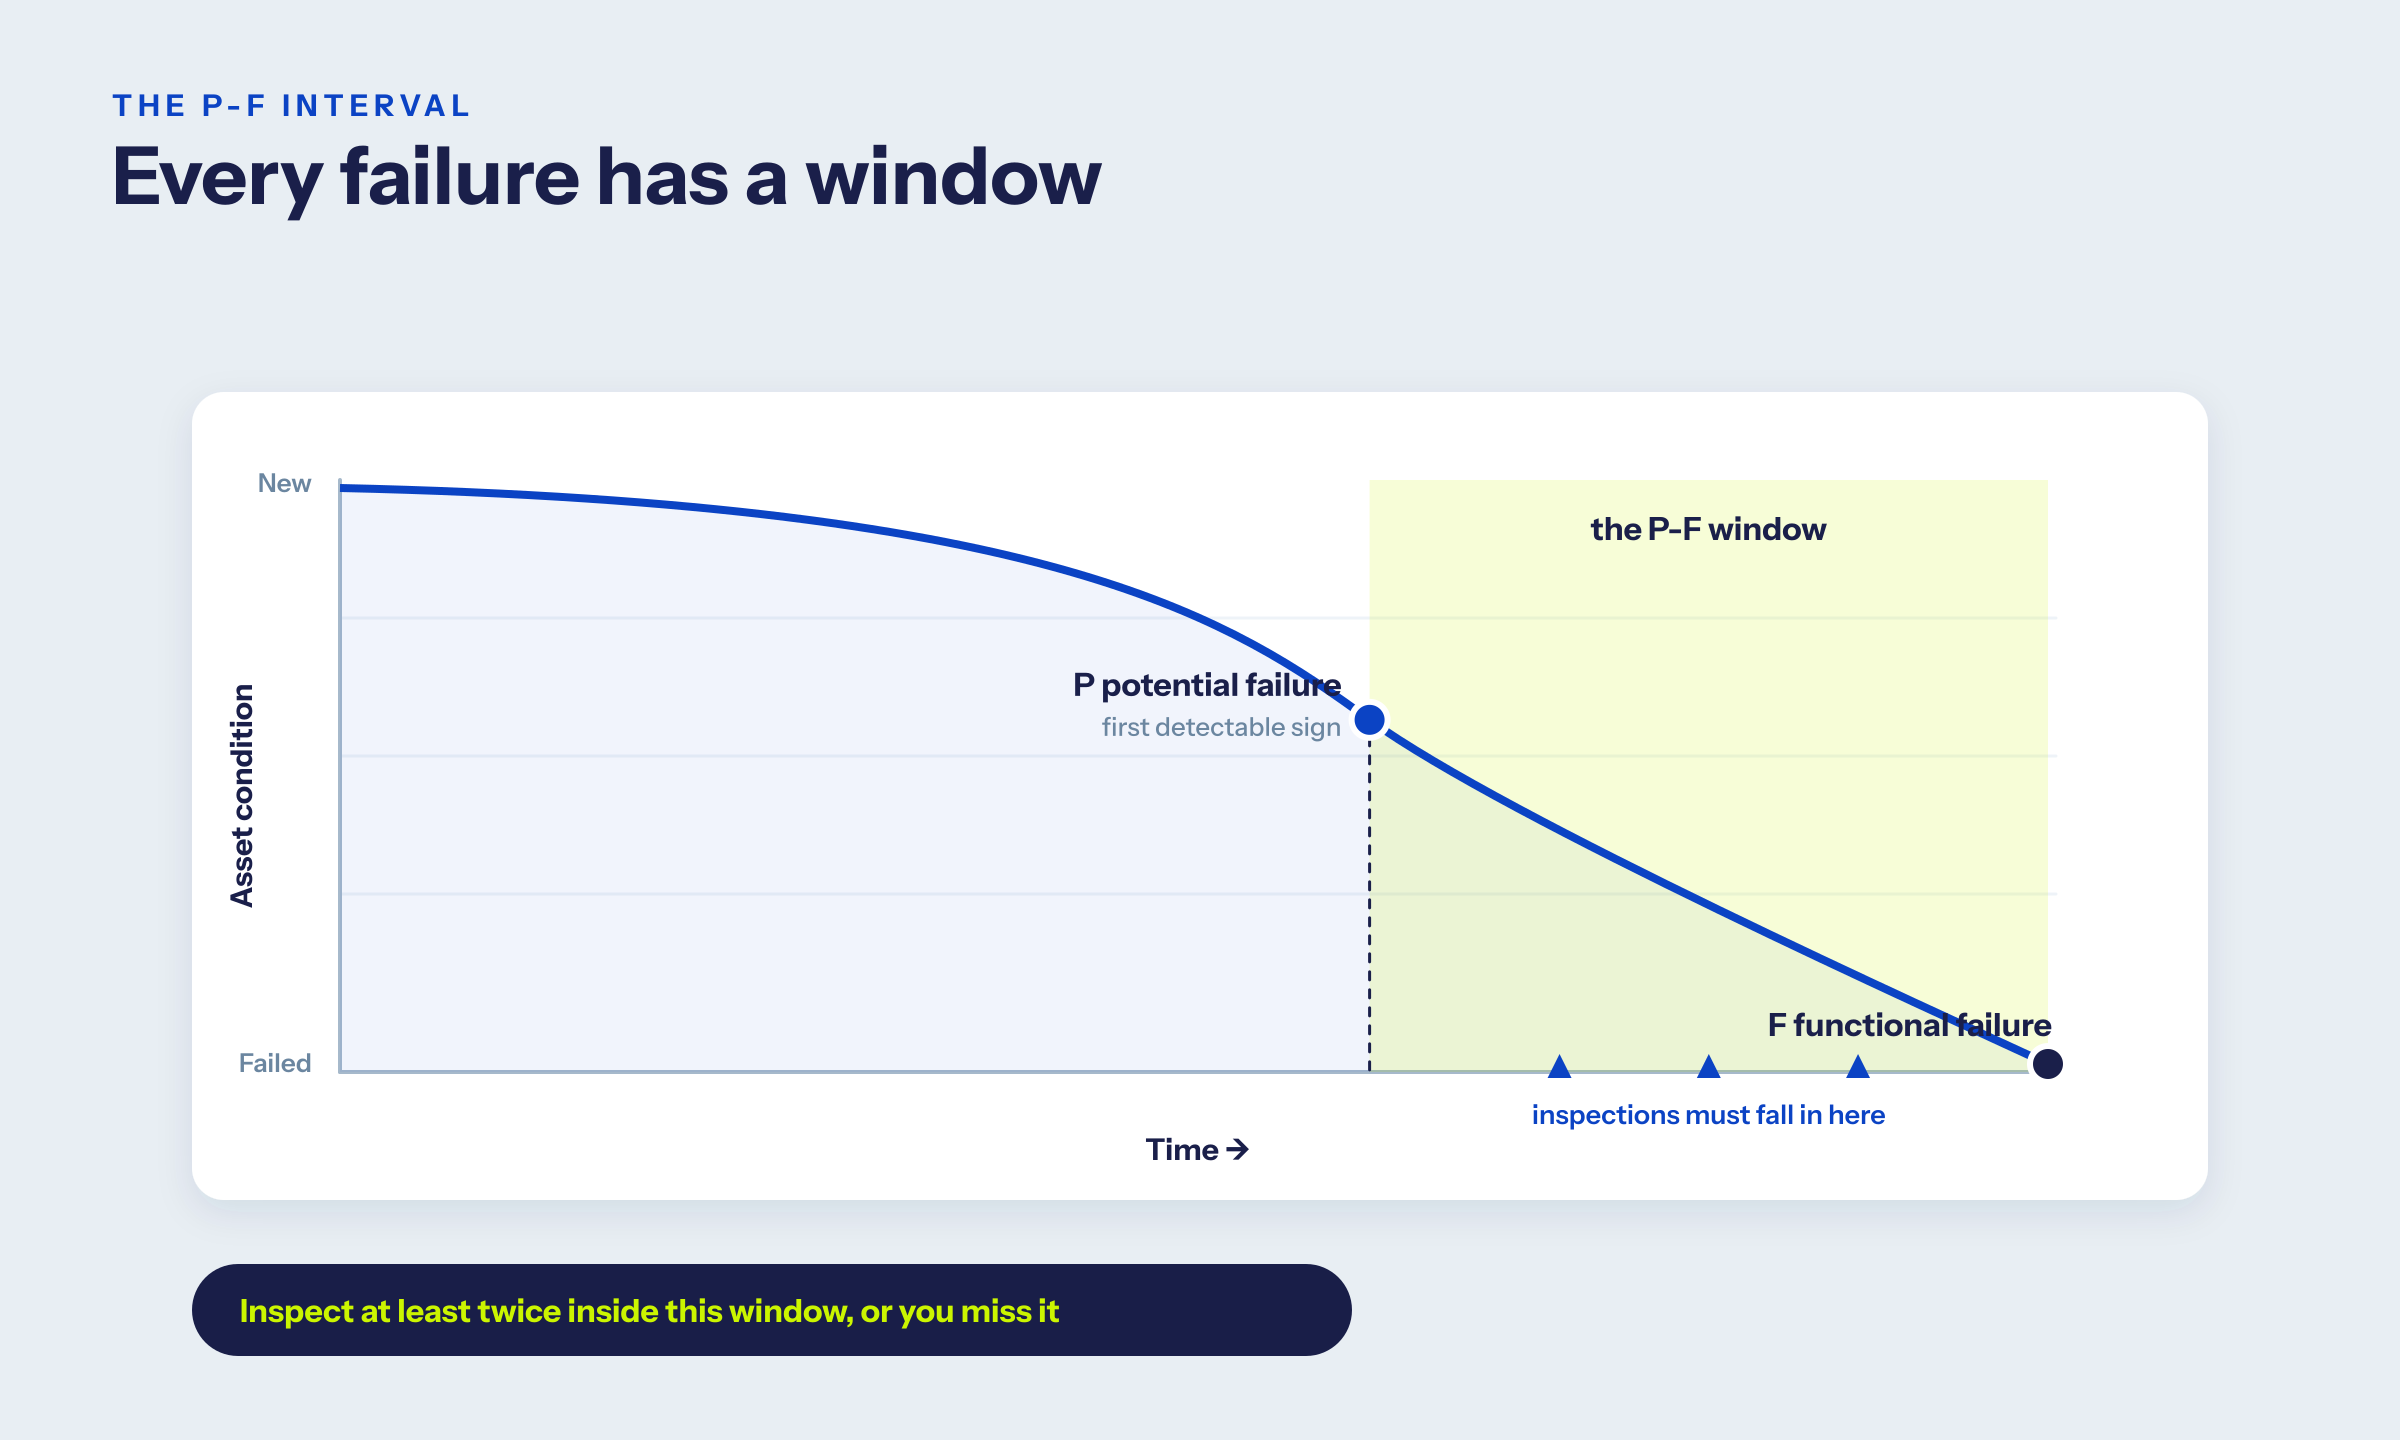
The real problem isn't your crew. It's your clock. Every failure has a window: the stretch between the moment it first becomes detectable and the moment the line goes down. Inspect once inside that window and you catch it. Miss the window and you don't. Calendar-based programs hope the schedule lines up with the windows. For the failures that matter most, it usually doesn't.
What causes grid failures between inspections?
Grid failures between inspections come from failure modes that develop faster than the inspection cycle returns. Connectors loosen and heat under load cycling. Corrosion crosses from detectable to critical. Pole rot accelerates in wet ground, vegetation grows into clearance, and storm-damaged hardware stands weakened until the next event. A structure can pass every scheduled inspection and still fail, because the failure's window never overlapped a visit.
That window has a name - the P-F interval, covered below. What it implies is uncomfortable: the failures that cause outages are usually not the ones a crew walks past. They are the ones that started after the crew left. Four clocks run between your visits:
- Load-cycle clocks. A loose connector heats and cools with every daily peak. It can move from fine to failed inside one summer.
- Decay clocks. Steel-core corrosion and wood rot progress quietly for years, then quickly at the end - and the end rarely waits for the next cycle.
- Growth clocks. Vegetation closes clearance on a schedule set by rainfall, not by your patrol calendar.
- Event clocks. Ice, wind, and lightning can weaken hardware the day after a patrol - and leave it standing until the next storm finishes the job.
The field evidence says these gaps are where the expensive failures live. On a newly built ~250-mile HVDC intertie of roughly 2,600 lattice towers, a clevis bolt backed off with its cotter key missing, high in a suspension assembly. The line was commissioned in spring; the defect would have failed under winter load. It sat inside the first operating season, in the gap between the commissioning record and the next scheduled look. An imagery campaign of more than 122,000 frames flagged it (1,270 findings, 30 days, 3 people). Clearing it took 120 minutes of field time and averted $1M+ in forced-outage revenue (Detect Data Quality Program, 2026).
The other side of the same problem: calendar programs under-count what is already failing. Two 40-plus-year-old wooden H-frame lines had been patrolled for a decade while capital requests were denied. A 3-person drone crew covered all 96 structures in one field day. It flagged 55 high-risk conditions - 35 on one line, 20 on the other: rotten poles, missing through-bolts, splitting cross-arms (Detect case study, 2026). The rebuild was funded in a 10-minute meeting. The defects were not new. The evidence was.
Whether a between-cycle defect is even detectable depends on the capture, not just the calendar. On Detect's 258-type transmission defect catalog, sharp imagery leaves 100 percent of the catalog assessable. Soft imagery drops that to 69 percent; blurry imagery, 7 percent (Detect Data Quality Program, 2026). The fastener-level defects that cause outages vanish first when capture slips - the mechanism behind the assessability ceiling.
Closing the gap is not about flying more. It means keeping a current, graded image baseline of every structure, trending condition between cycles, and moving verified findings into scheduled work while the window is still open. The finding-to-work-order pipeline is its own discipline - and so is verifying AI-flagged findings before a crew rolls. The rest of this guide is the framework that decides which structures earn that treatment.
What is reliability-centered maintenance?
RCM isn't new and it isn't ours. It came out of commercial aviation in the 1960s and is written down as a standard, SAE JA1011. Strip away the formality and it changes one thing: the question you ask about every structure.
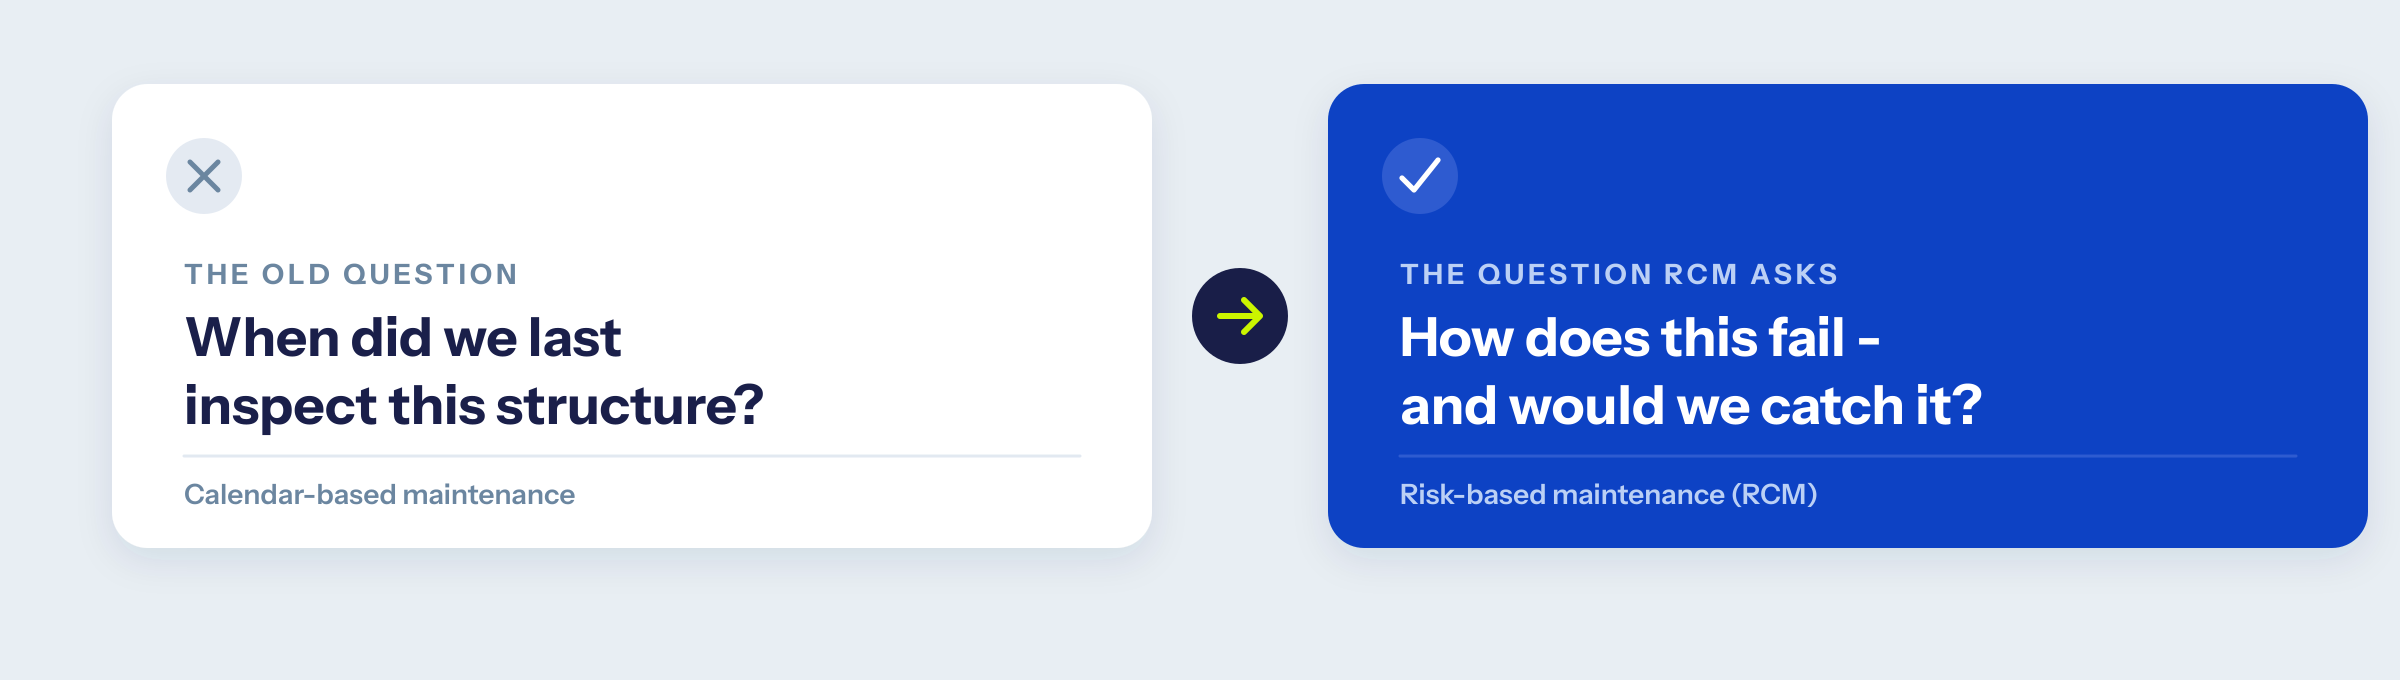
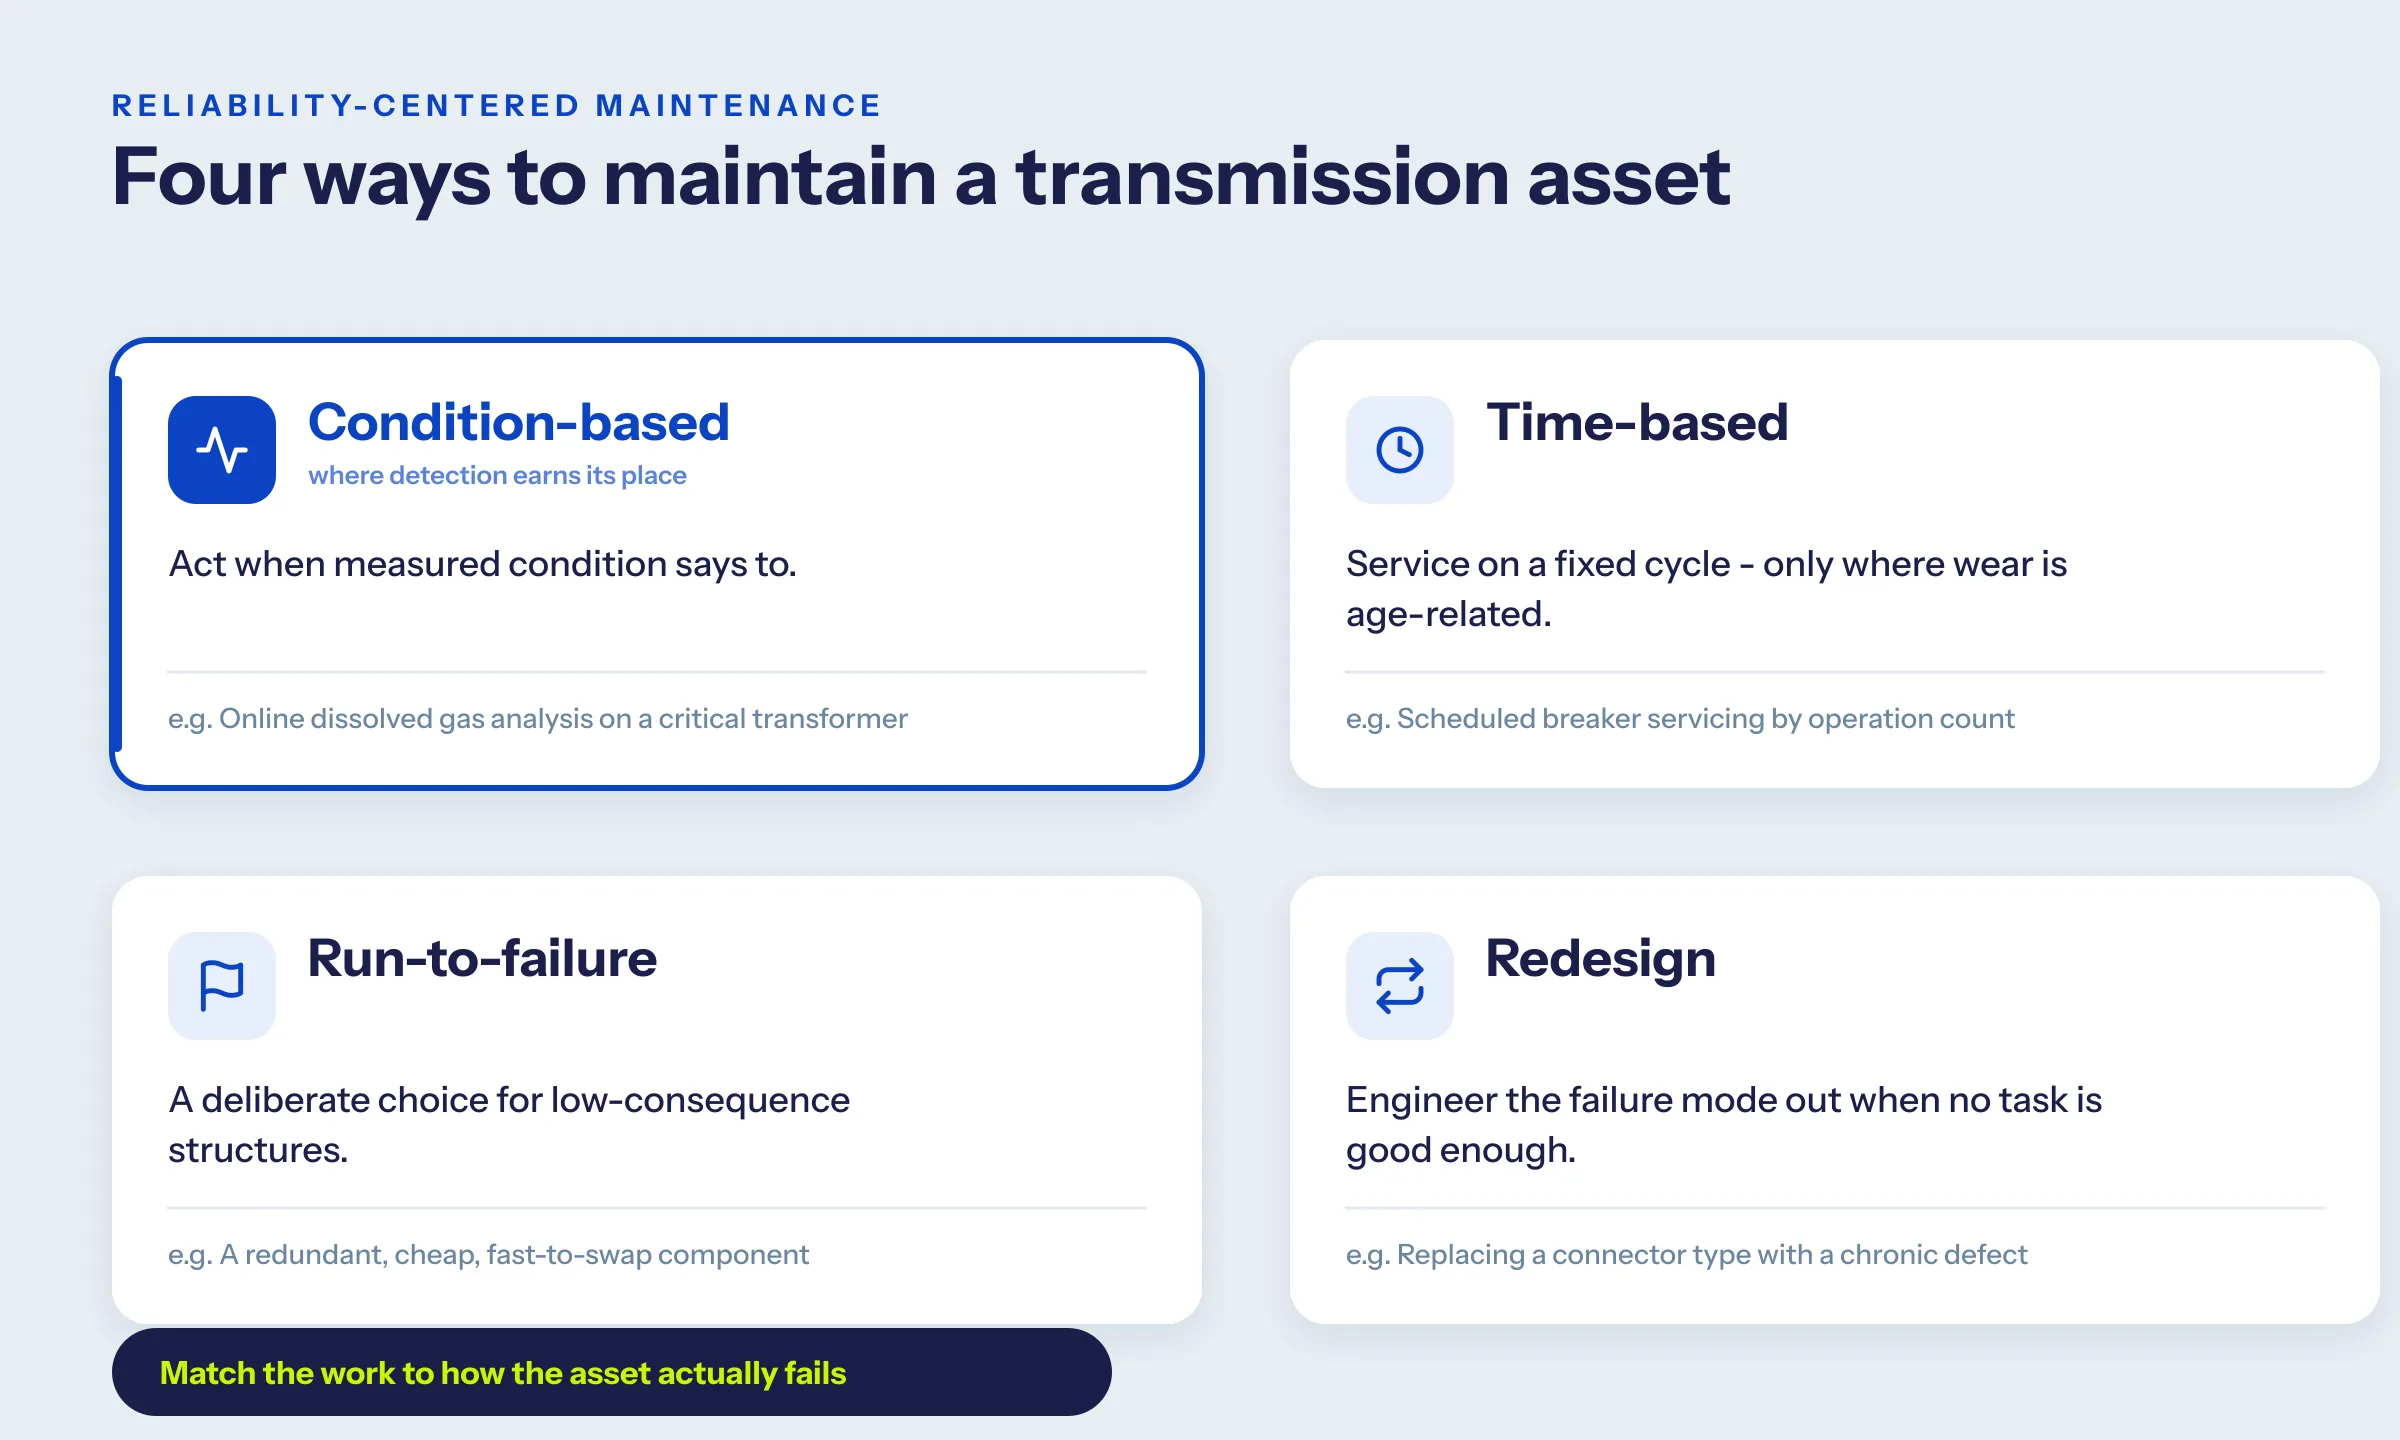
Instead of "when did we last inspect this," RCM asks "how does this actually fail, and would we catch it in time?" That shift produces a deliberate choice of work for each failure mode, drawn from four strategies.
The tool that turns this into intervals is the P-F curve - the window between potential failure (the first detectable sign) and functional failure (the line goes down). The rule of thumb: your inspection interval has to be shorter than half that window to catch the failure in time. When the window is weeks and your cycle is years, no calendar will save you. That is the case for condition-based detection, in one line.
How to apply RCM to transmission asset management and maintenance
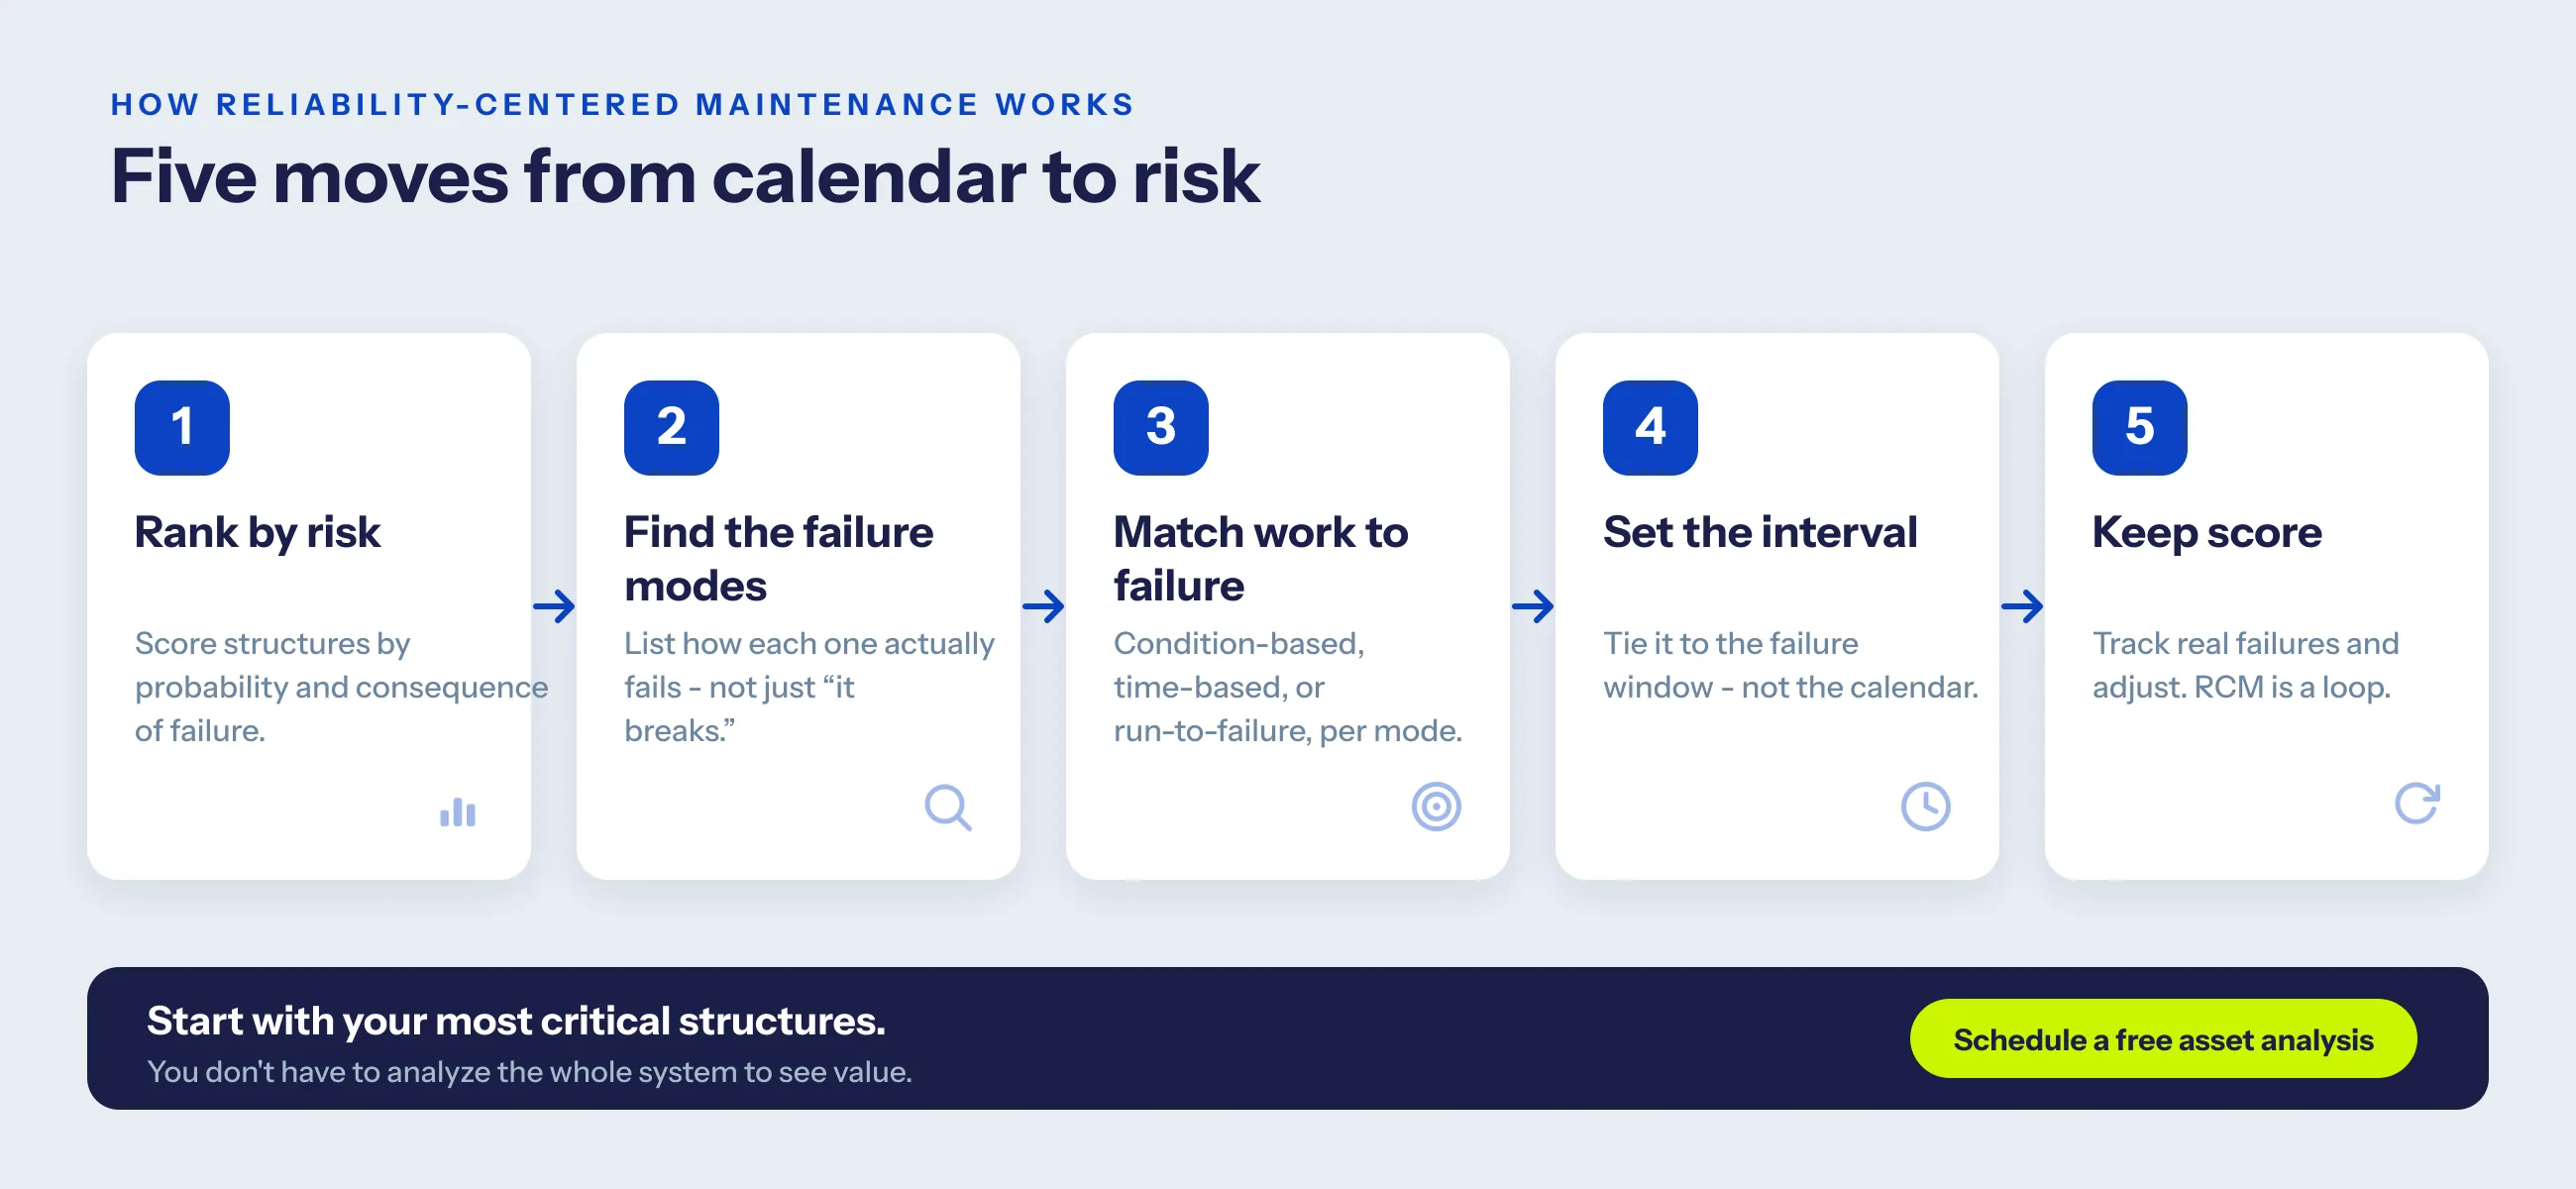
This is the sequence, drawn from the NASA RCM Guide and SAE's standard, adapted for a transmission system. Strip away the formality and it's five moves.
Step 1: Start with what hurts
Rank your structures by two things: how likely each is to fail, and how bad it is when it does. A single-contingency transformer and a redundant tap line are not the same problem and shouldn't get the same attention. Most programs spread effort evenly across the system. That's the first habit to break. Inside the substation fence, the same ranking sets how often substations are inspected: SDG&E walks its highest-priority stations monthly and the rest every two months (CPUC audit, 2023).
Step 2: Learn how each one fails
For the structures that matter, write down the actual failure modes - corrosion, contamination, connector heating, bushing degradation - not "it breaks." This failure-mode analysis (engineers call it FMEA) is the step most programs skip, and it's the one that makes everything after it real. Equipment failure detection is only ever as good as the failure list behind it.
Step 3: Match the work to the failure
Once you know how something fails, the right task is usually obvious. Age-related wear takes time-based service. A failure that gives warning signs takes condition-based monitoring. Something cheap to replace can run to failure on purpose. Good preventive maintenance strategies aren't one-size - the whole point is to choose deliberately.
Step 4: Set the interval to the window, not the calendar
For anything you monitor, check more than once inside the failure window. If the window is too short to inspect your way into - and for a lot of the worst failure modes, it is - that's your signal to put a sensor on it or engineer the failure out entirely.
Step 5: Keep score
Track what actually fails against what you predicted, and adjust. RCM is a loop, not a binder on a shelf.
Scoring criticality: a simple starting rubric
Step 1 is where most programs stall, because "rank by risk" sounds vague. It doesn't have to be. Score each structure on two axes from 1 to 5, then multiply for a risk score from 1 to 25.
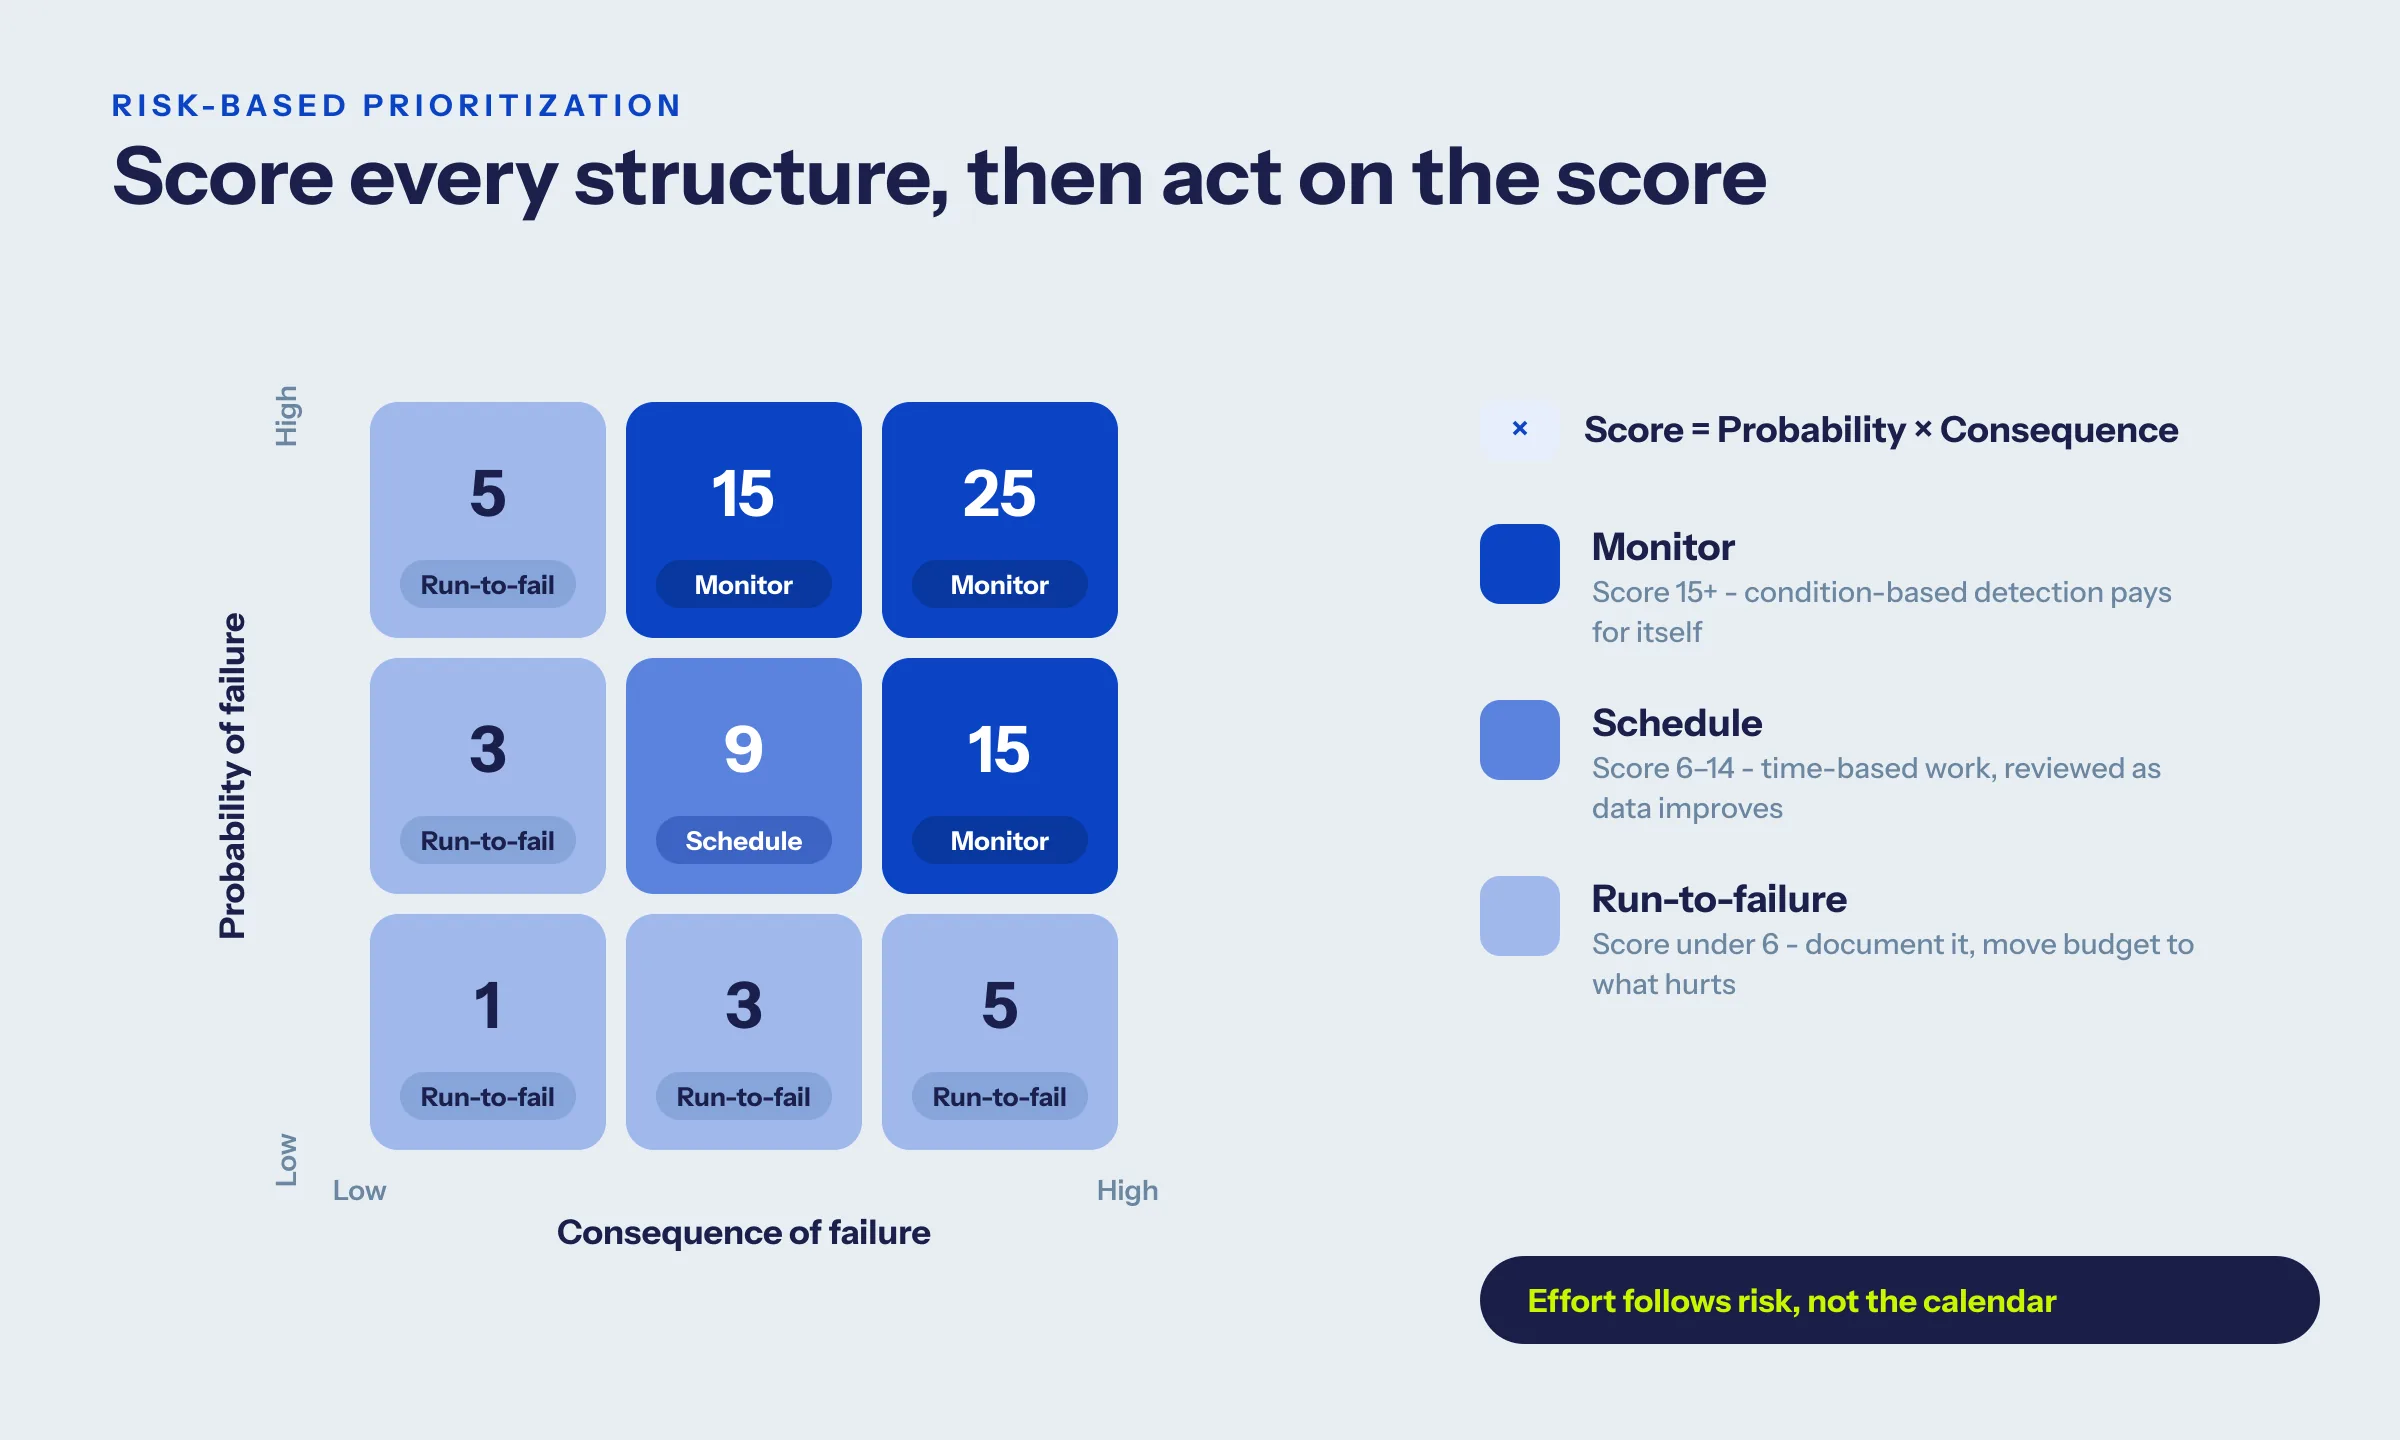
Then act on the score:
- 15 and above - your candidates for condition-based monitoring. These are where sensors and faster detection pay for themselves.
- 6 to 14 - scheduled, time-based work, reviewed as condition data improves.
- Below 6 - run-to-failure candidates. Document the decision and move the budget to the structures that can hurt you.
Tune the cut lines to your system. The point isn't the exact numbers - it's that effort follows risk instead of the calendar.
A worked example: running a transformer through RCM
The five steps stay abstract until you put a real asset through them. Take a large power transformer - the highest-stakes structure on most systems, with the longest replacement lead time and the most internal failure modes.
It doesn't have one failure mode. It has several, each on its own clock and each calling for different work:
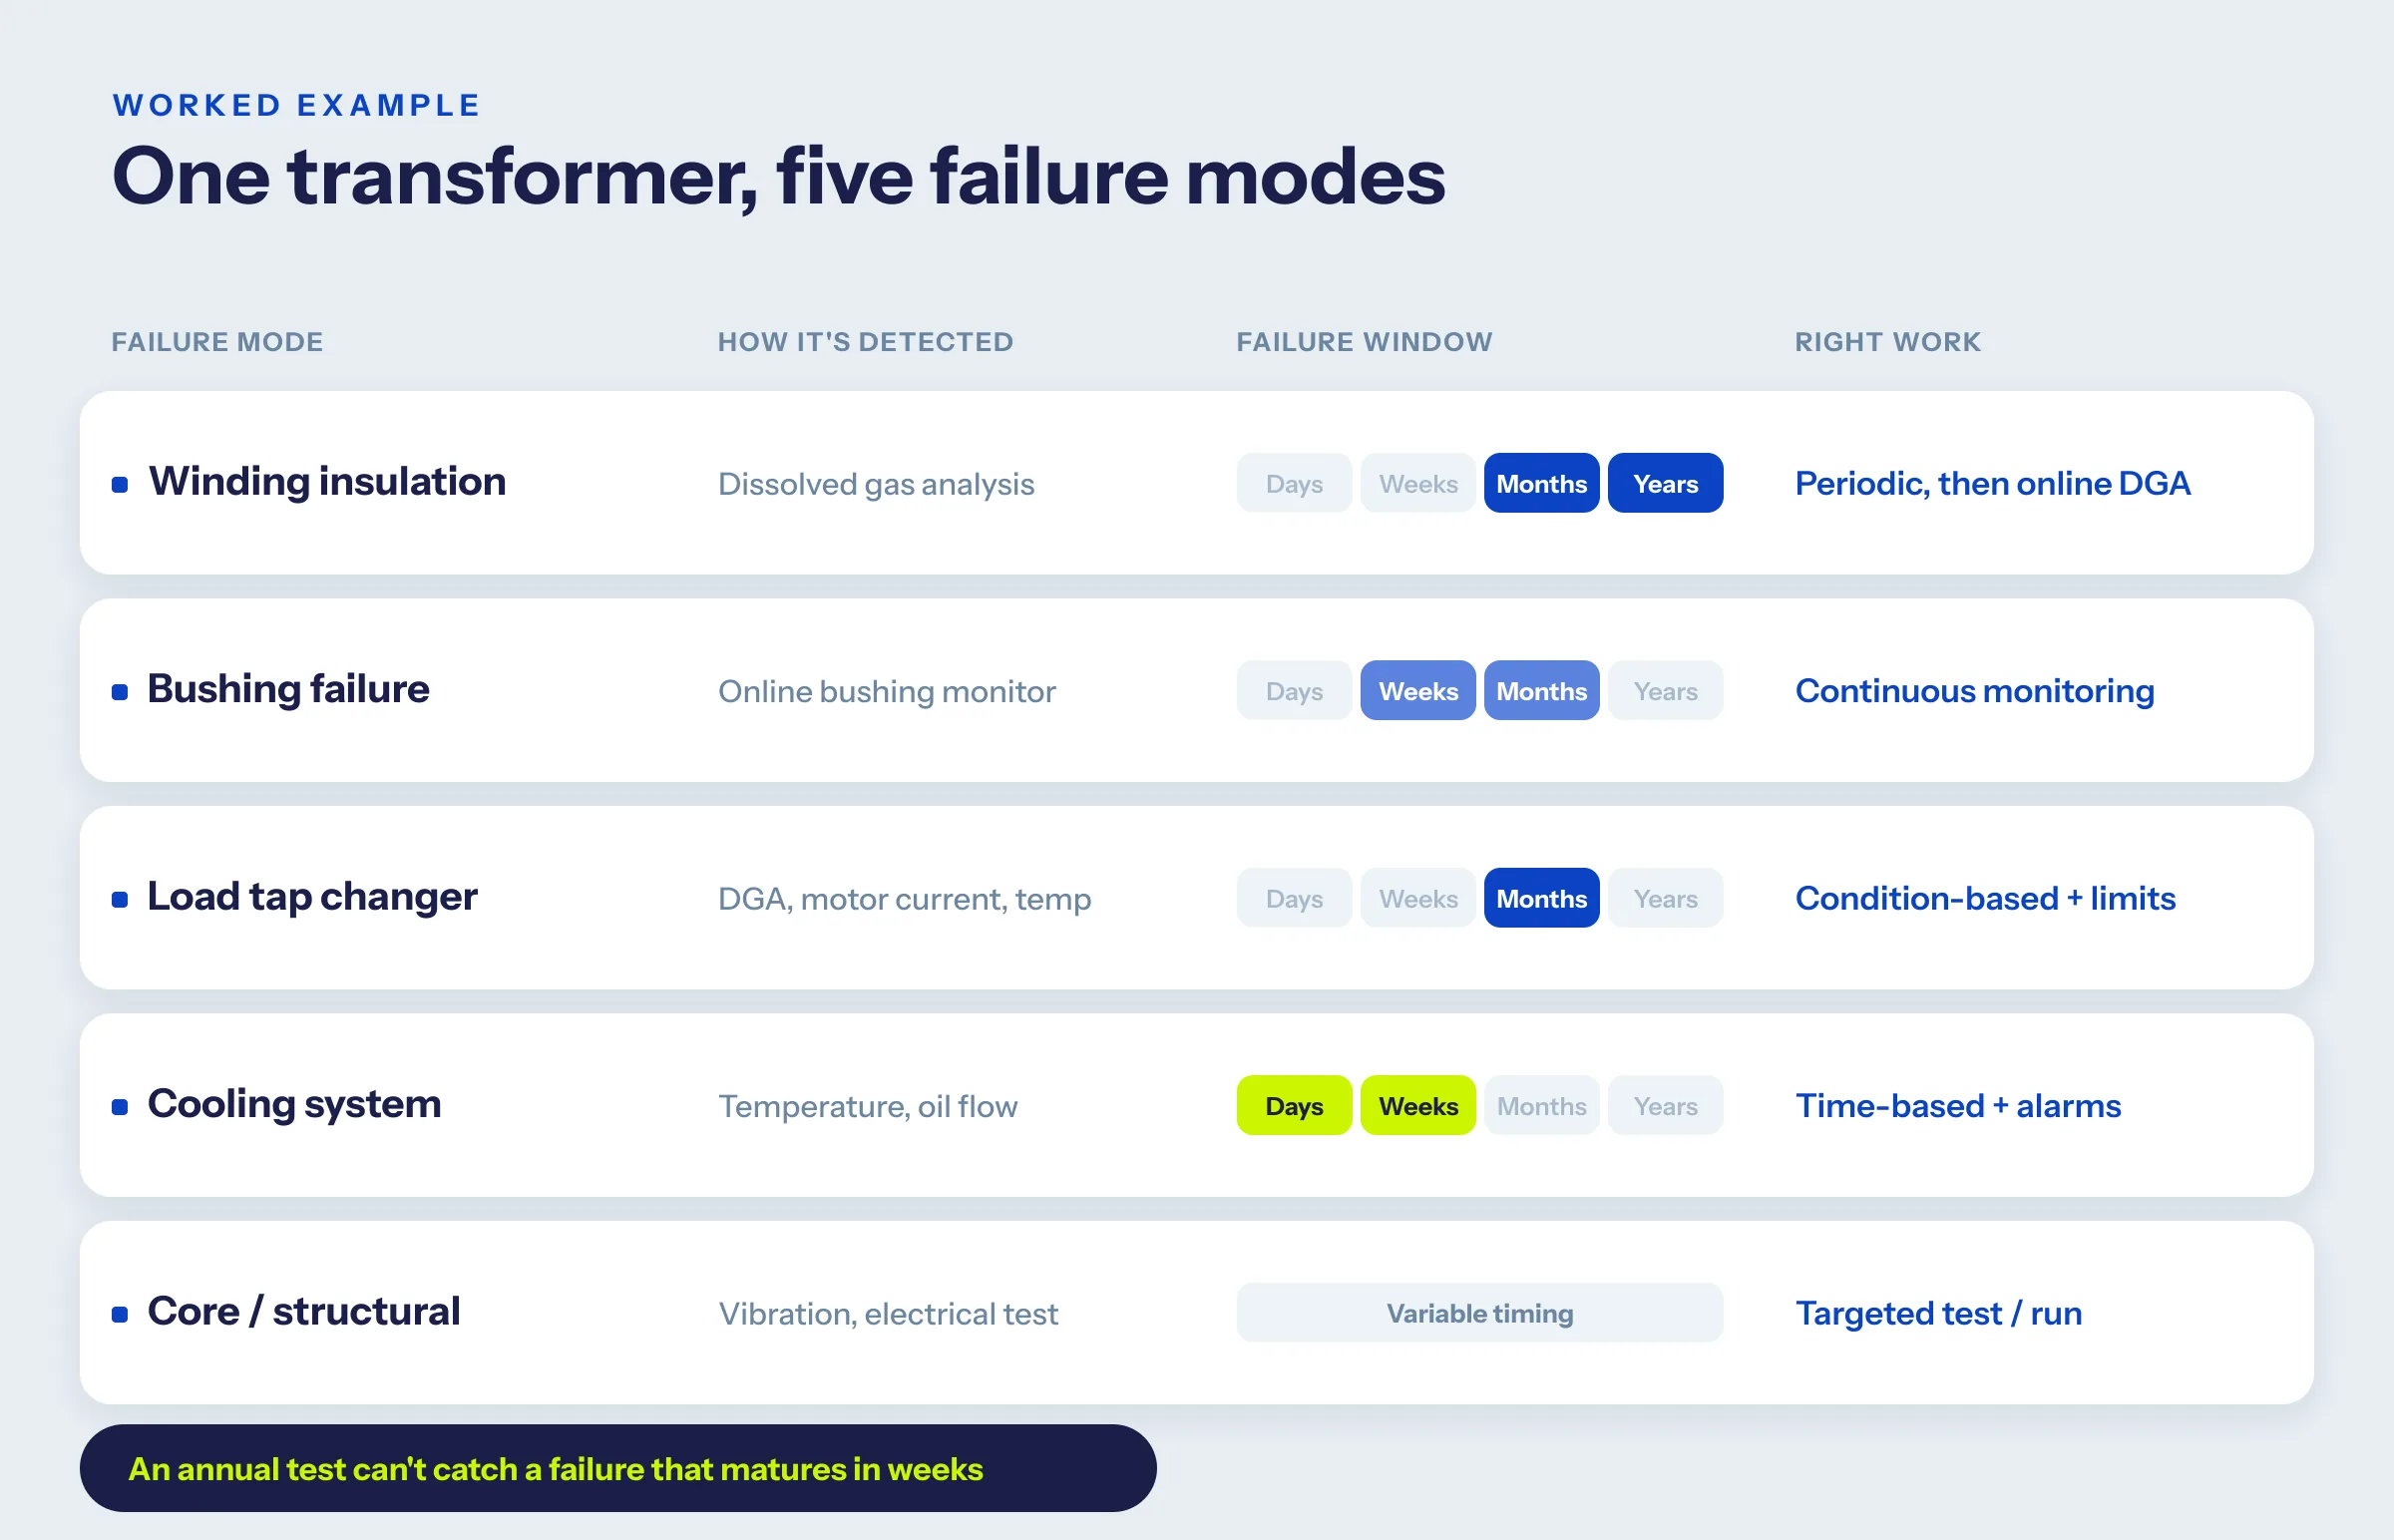
Walk it through.
Step 1: if this transformer is a single-contingency unit with a two-year replacement lead time, it sits at the top of your criticality ranking - full stop.
Step 2: you list the modes above instead of treating "transformer failure" as one thing.
Step 3: the high-consequence, slow-warning modes (winding, bushing) get continuous monitoring; cooling gets time-based service with alarms; a low-criticality core risk on a spare-backed unit might be left to run.
Step 4: because a bushing can move from detectable to failed in weeks, an annual test won't catch it - so it gets an online monitor, not a calendar entry.
Step 5: every DGA result and trip feeds back into the model, sharpening the next decision.
That's the whole method on one asset. Now repeat it for your conductor classes, your insulators, and your breakers, hardest-hitting first.
What to monitor vs. what to let fail on purpose
Run-to-failure has a bad reputation it doesn't always deserve. Choosing it deliberately, for the right structures, is what frees up budget for the assets that can actually take you down. The triage logic is straightforward.
Monitor (condition-based) when all three are true:
- The failure carries real consequence - safety, a sustained outage, or a long-lead-time replacement.
- The failure gives a measurable warning sign before it happens.
- A practical sensor or test exists to catch that sign in time.
Schedule (time-based) when:
- The failure is genuinely age- or cycle-related and predictable.
- Monitoring would cost more than the periodic service is worth.
Let it run to failure when:
- Consequence is low, and the structure is cheap and fast to replace.
- There's no safety or environmental risk in letting it fail.
Never run-to-failure for anything tied to safety, the environment, a single-contingency position, or a part with a multi-month replacement lead time. Those earn protection regardless of cost.
Faster equipment failure detection workflows
Notice what all five steps keep demanding: see the failure earlier. That isn't a flying problem. It's a data problem, and it starts after the drone lands.
Capturing images of a tower is the easy part now. Everyone can fly. The hard part is turning thousands of images into reliable findings fast enough to act - before a storm finds the weak structure first. The technologies that move detection earlier on the P-F curve include:
- Continuous transformer monitoring and dissolved gas analysis
- Infrared thermography for connectors and splices under load
- Dynamic line rating for real-time conductor condition
- Aerial LiDAR for clearance and structural deflection
- Machine-learning defect classification across large image sets
Where AI actually fits
The inspection market is full of overpromises, so be clear-eyed about this. AI doesn't replace your engineers. It screens the volume so your experts spend their hours on the findings that matter instead of sorting images. DetectOS is built for exactly that step - taking the visual data you already collect and turning it into findings your team can stand behind. The judgment stays human. The scale becomes manageable.
And it only pays off inside a framework like RCM. Bolt analytics onto a calendar-based program and you've spent money to confirm inspections you were already going to run. Aim them at the failure modes that actually cause outages, on the windows that actually matter, and the outage numbers move.
The business case for preventive maintenance strategies
The math isn't subtle:
- Reactive costs more. Run-to-failure maintenance, when it isn't chosen on purpose, runs three to five times the cost of catching a problem early once you count the downtime.
- Condition-based pays back fast. These programs routinely cut unplanned downtime by 30 to 50 percent and maintenance cost by 10 to 40 percent, per Deloitte.
- The replacement clock is unforgiving. A missed transformer defect can mean 80 to 210 weeks without the asset.
There's a compliance edge too. NERC's FAC-003-5 standard took effect in 2024 and reliability-standard violations carry penalties of up to $1 million per day. A documented RCM program is your answer when a regulator asks why a structure was maintained the way it was. "We followed the schedule" is a weaker answer than "here's exactly how this asset fails, and here's how we cover it." Frameworks like ISO 55000 sit above all of this; RCM is how you operationalize them at the structure level.
Putting a number on the outage you prevent
The hardest part of the capital case is valuing an event that didn't happen. Here's a rough framework you can build a defensible number from, with LBNL's ICE Calculator doing the heavy lifting on lost-load cost. It's directional, not precise - run the real figures for your system before you take it to a rate case.
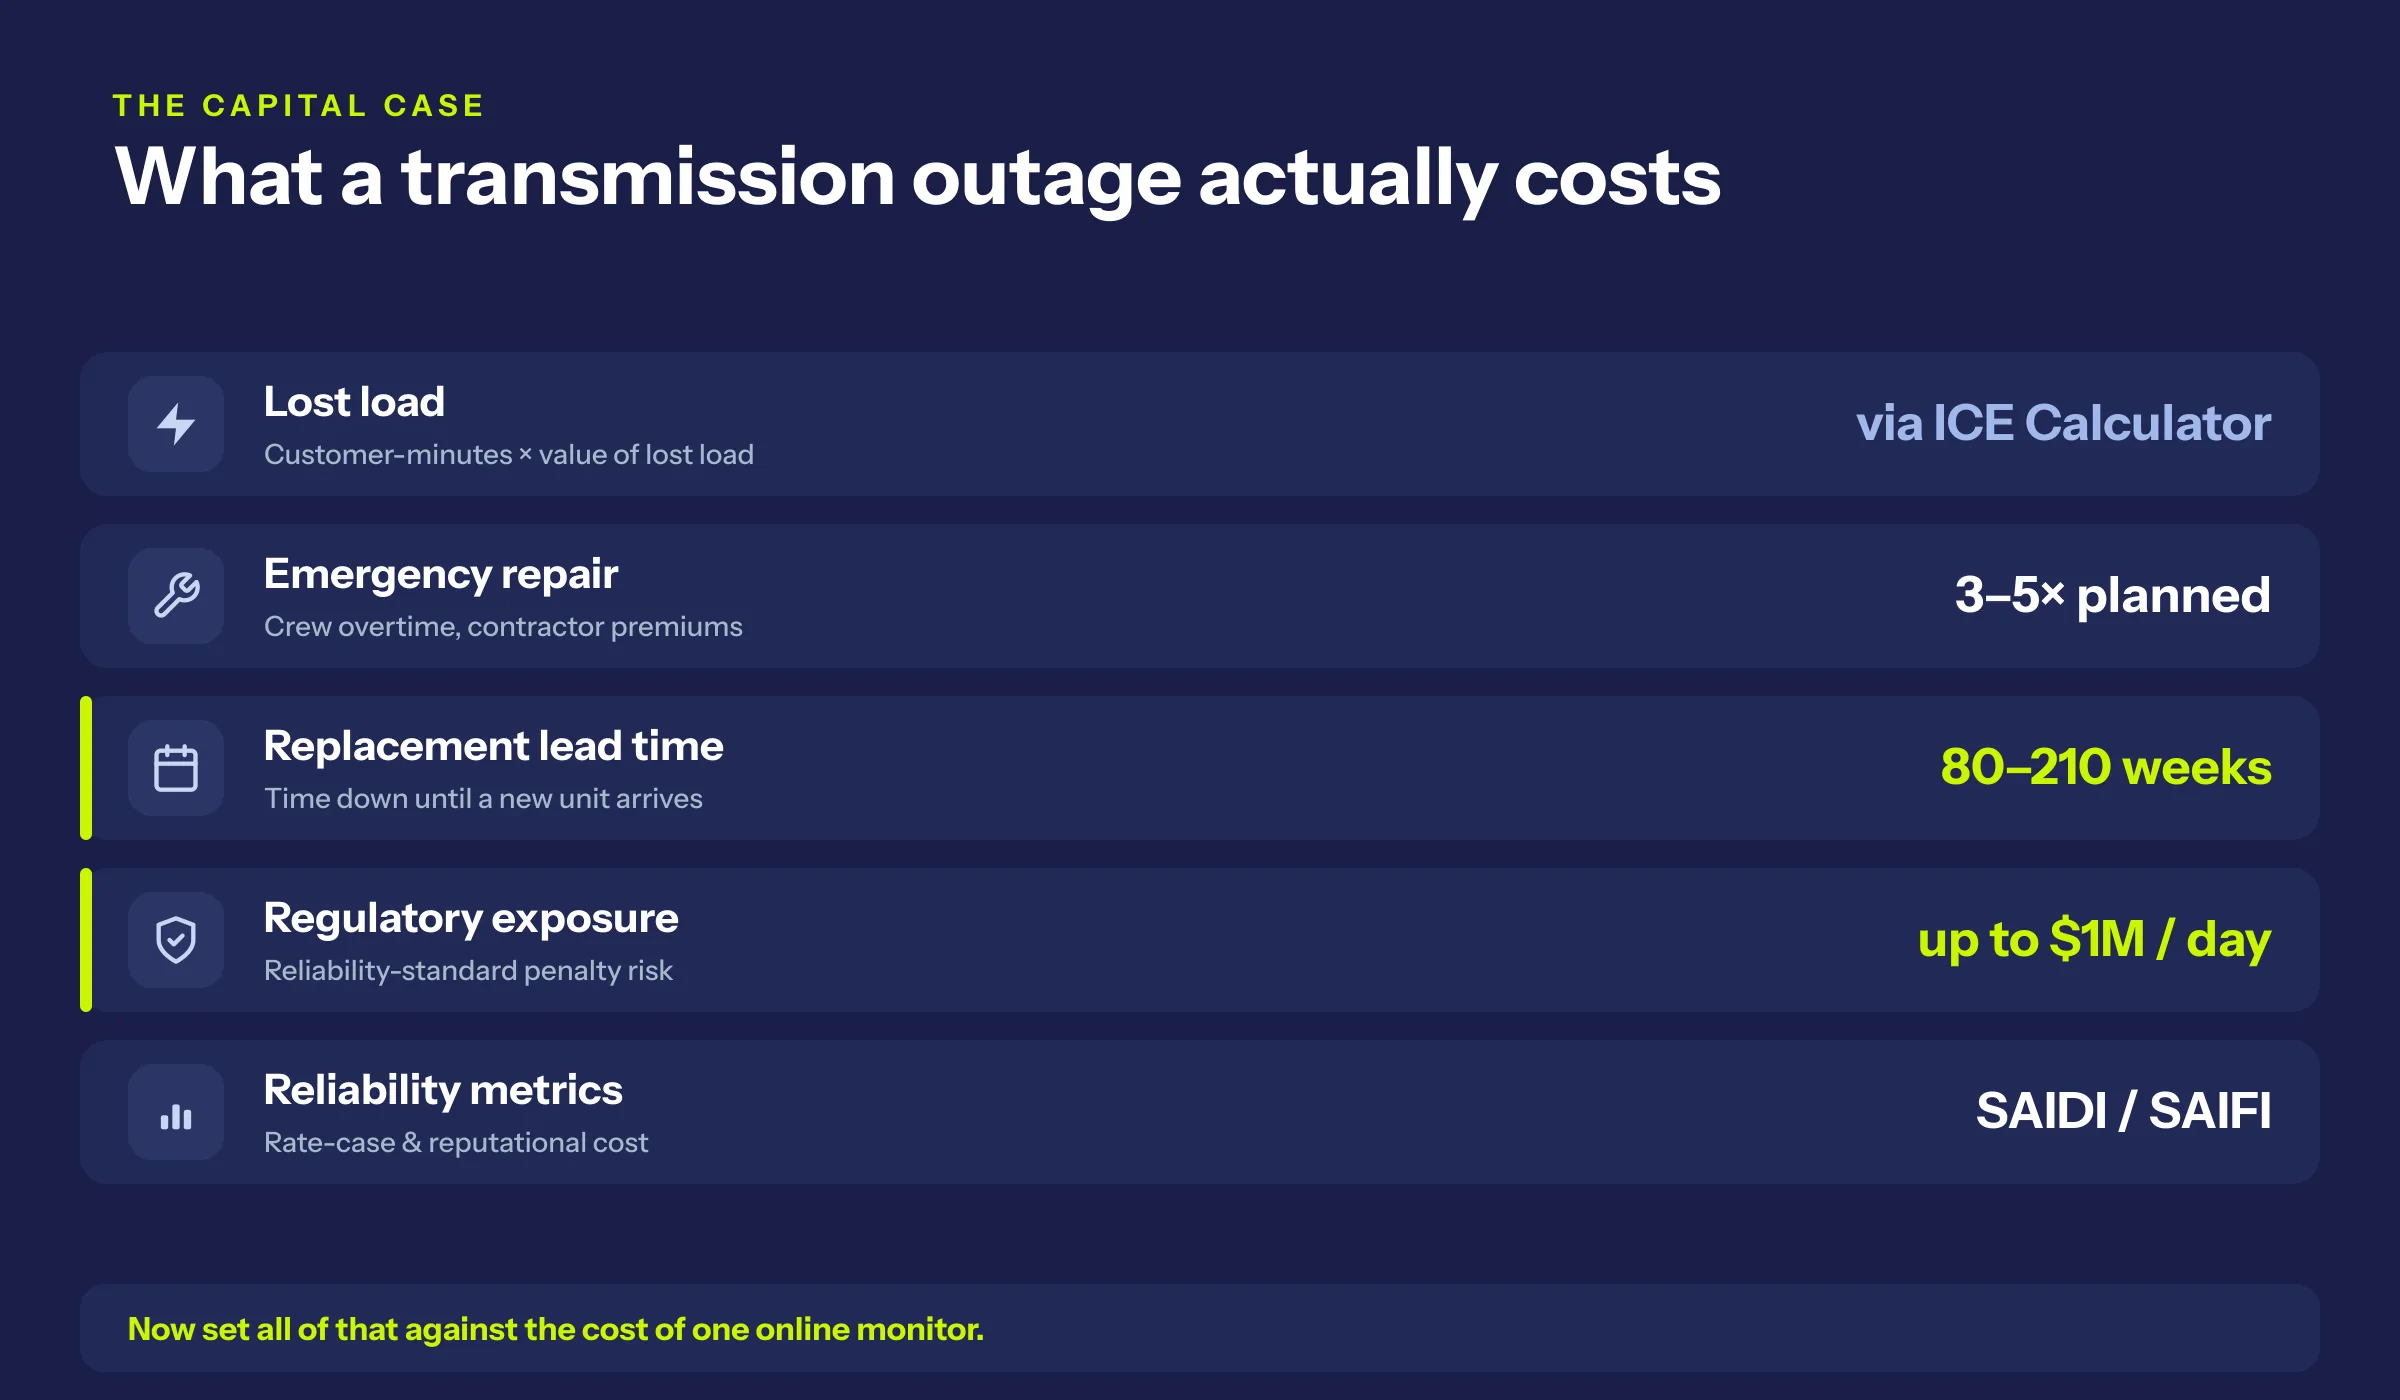
Worked roughly: a sustained transmission outage that interrupts tens of thousands of customers for several hours can run into the millions in lost-load cost alone, before repair premiums or penalties. Set that against the cost of an online monitor on the structure that would have caught it, and the prioritization argument writes itself. The point of the graphic isn't the total. It's that every line is a number you can source and defend.
Where RCM is hard, and where it isn't worth it
This is not a free win, and a guide that pretends otherwise isn't worth your time. The honest constraints:
- The analysis is real work up front. A proper failure-mode analysis takes engineering hours before a dollar of savings shows up. Budget for the ramp, and start with the critical few so the program ships something before it loses momentum.
- Monitoring is capital. Online sensors on transformers and bushings aren't free. The triage exists precisely because you can't monitor everything - and shouldn't try.
- It needs data you may not have. If your asset records and condition history are thin, Step 2 gets harder. Sometimes the honest first project is fixing the data and capture quality before the RCM model can stand on it.
- Calendar-based is genuinely fine for some assets. Low-consequence, age-related, cheap-to-replace structures don't need this machinery. Over-engineering the easy assets is its own kind of waste.
- It changes who decides. Moving from a fixed schedule to risk-based work shifts authority over what gets worked and when. That's a cultural change, and crews who trust the calendar will push back. Name it early.
- It's a program, not a project. The value compounds over years as the model learns from real failures. A one-quarter pilot proves the case. It doesn't finish the job.
None of this is a reason to stay on the calendar. It's the difference between a program that survives contact with your organization and one that stalls in year one.
Common mistakes that sink RCM programs
RCM fails in predictable ways. Avoid these and you avoid most of the pain:
- Boiling the ocean. Trying to analyze every structure at once stalls the program before it ships a single work plan. Start with the critical few.
- Monitoring without acting. Sensors that feed a dashboard nobody reviews are not a program. Detection only counts if it changes a work order.
- Skipping the criticality ranking. Without it, effort spreads evenly again and you've quietly rebuilt the calendar you were trying to leave.
- Treating it as one-and-done. An FMEA that never gets updated with real failure data goes stale fast. RCM is a loop.
- Ignoring hidden failures. Protection, relays, and cooling can fail silently and stay invisible until the day you need them. Those need deliberate testing, not assumption.
- Confusing capture with findings. Collecting images faster doesn't help if the findings stay slow, inconsistent, or buried. The value is in the data quality, not the flight count.
A 90-day starting point
You don't have to analyze the whole system before you see value. Start narrow and prove it.
- Month 1 - Rank and benchmark. Build a criticality-ranked register using the rubric above, and benchmark your own SAIDI and SAIFI against peers. Quantify what your outages actually cost so you have the capital case in hand.
- Months 2-3 - Analyze the critical few. Run a full failure-mode analysis on your top-criticality structures only - the large power transformers and single-contingency circuits. Plot the P-F window for each mode and pick the lowest-cost detection method that fits inside half of it.
- End of quarter - Pilot and measure. Put condition-based monitoring on ten to fifteen of those assets and measure the downtime reduction against the benchmarks above.
That's enough to know whether the model works on your system. It almost always does.
Not sure where your current program stands? Detect runs a free asset analysis on a sample of your structures that shows what today's inspections are missing.
Reliability-centered maintenance doesn't replace your experts. It tells them where to look.
The line that fails this winter is probably failing right now. Quietly. Somewhere your last inspection couldn't see. The weather will take the blame, and the weather will only have been the trigger.
You can't fix the weather. You can stop running a program built to find the failures that were never going to cause an outage, and start aiming your crew, your budget, and your detection at the ones that will.
Reliability-centered maintenance doesn't replace your experts. It tells them where to look. That's the entire job - and on a grid this old, carrying this much load, it's the difference between a finding and an outage.

Frequently asked questions
What causes power outages?
Weather is the largest single trigger of transmission outages, but the underlying causes that turn weather into sustained outages are aging hardware - corroded conductors, degrading insulators, end-of-life transformers - along with vegetation contact, undetected equipment defects, and rising load on assets past their design age.
Why do manual inspections miss transmission defects?
Many failure modes are physically invisible to the eye: internal insulator defects, steel-core corrosion under aluminum strands, internal transformer faults, and connector overheating that only appears under load. Inspection cycles also run far slower than failures develop - climbing inspections can sit on 12-year cycles - so a defect can progress to failure between visits.
How is reliability-centered maintenance different from preventive maintenance?
Preventive maintenance services assets on a fixed cycle. RCM first analyzes how each asset fails, then assigns the right strategy per failure mode, which may be condition-based, time-based, run-to-failure, or redesign. Preventive maintenance is one possible output of RCM, not the whole method.
What is FMEA in reliability-centered maintenance?
FMEA - Failure Mode and Effects Analysis - is the step where you list every way a structure can fail and what each failure causes. It produces the failure list that the rest of RCM depends on. Skip it and you're back to maintaining on habit.
What is condition-based maintenance?
Condition-based maintenance triggers work based on the measured condition of an asset rather than a fixed schedule - for example, acting on a rising dissolved-gas trend in a transformer. It's the strategy RCM assigns to high-consequence failures that give a detectable warning sign.
What is the P-F interval?
The P-F interval is the window between the moment a failure first becomes detectable and the moment the asset actually fails. To catch a failure in time, your inspection or monitoring interval should be less than half the P-F interval.
Is reliability-centered maintenance worth it for utilities?
The benchmarks are strong: condition-based programs typically cut unplanned downtime by 30 to 50 percent and maintenance cost by 10 to 40 percent, and reactive maintenance costs three to five times preventive work. RCM also produces the documented, risk-based justification regulators and federal grid-funding programs increasingly expect.
What causes grid failures between inspections?
Failure modes that develop faster than the inspection cycle: connector heating under load cycles, corrosion and wood rot crossing from detectable to critical, vegetation growth, and storm-weakened hardware. If a defect's P-F window is shorter than the time between visits, calendar inspection cannot catch it - condition monitoring or a shorter effective interval can.
How often are power lines inspected?
It varies by voltage, method, and risk zone. Aerial and ground patrols commonly run once or twice a year, while detailed climbing inspections can sit on multi-year cycles - PG&E's published guidelines put climbing inspections of 500 kV lines in lower-risk areas on a 12-year cycle. Risk-based programs shorten the interval wherever the failure window demands it.
Why does the power go out?
Usually because weather has hit a weak point. Wind, ice, and lightning trigger most sustained outages - about 80% of U.S. customer outage hours in 2024 (EIA, December 2025) - but the weak point is typically hardware that was already degrading: a corroded conductor, a loose connector, a rotting pole, or a tree inside clearance. Fix the weak point and the same storm passes without an outage.
How long do power outages last?
It depends on the cause. Across 2024 the average U.S. customer lost about 11 hours to outages for the whole year, and roughly 80% of that time came from major weather events (EIA, December 2025). An outage from a single failed component is usually shorter, but it repeats until the cause is found - which is why the defect, not the weather, is what a utility needs to fix.
Related reading: see how AI inspection software helps prevent grid outages and DetectOS for grid outage prevention.
