
How AI Inspection Software Helps Prevent Grid Outages
The defect-to-outage chain, the Failure Window, and how AI asset inspection helps utilities fix the right assets before they fail - across transmission and distribution.
- US grid reliability is getting measurably worse, and the assets are aging faster than crews can inspect them by hand.
- Over 90% of customer outages start on the distribution system (US Department of Energy), but the rare transmission failure can take out a whole region - so inspection has to cover both.
- Most equipment-driven outages do not happen suddenly. They start as a small, visible defect that worsens for months or years before the component fails. The worn part that started the 2018 Camp Fire had not been climb-inspected since 2001.
- Every such failure passes through a Failure Window - the time a defect spends Detectable, then Developing, then Down. AI inspection software exists to act while the defect is still detectable, and to track it across inspection cycles.
- AI inspection does four things at once that manual review cannot do at scale: catch more defects, rank them by outage risk, deliver findings same-day, and route them to experts for the final call.
- The goal is not to replace your inspectors. It is to point them at the structures most likely to fail next.
One idea runs through everything below: an outage is rarely a surprise. It is almost always a defect that stayed invisible too long. The work of AI asset inspection is to turn every image into decision-grade grid intelligence - so the moment you find a problem moves back to where it is still cheap to fix.
- Why grid outages are getting worse
- How a defect becomes an outage
- What is the Failure Window?
- How AI inspection prevents outages
- Manual vs. AI inspection
- Distribution and transmission
- Wildfire & vegetation risk
- What to look for in a platform
- Outage prevention in practice
- Where to start
- FAQ
Why are grid outages getting worse?
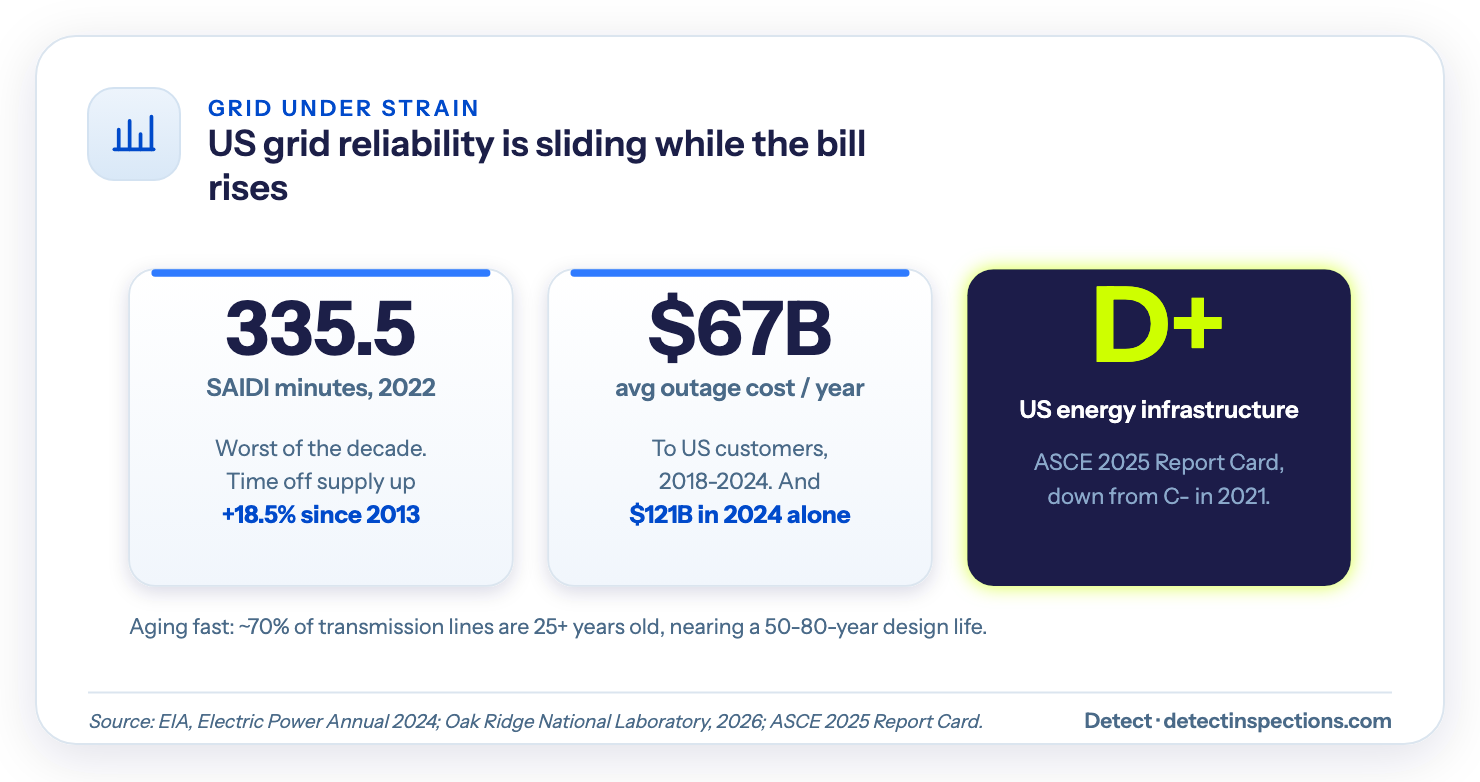
Grid reliability in the United States is sliding, and the numbers are not subtle. The average customer went without power for 335.5 minutes in 2022 - the worst figure of the decade. Time off supply has climbed steadily since 2013. Even with major storms stripped out, the average interruption time rose about 18.5% over those nine years (EIA's reliability data).
Where grid outages start: distribution vs. transmission
Most of that lost time is a distribution-system story. Over 90% of power interruptions start on the distribution grid, in both how often they happen and how long they last, according to the Department of Energy. Transmission failures are rarer. But when one happens, it takes out a region at once.
Either way, the failure usually starts at a single structure - which is exactly what an inspection looks at.
Why aging infrastructure raises outage risk
The infrastructure those failures run on is old. About 70% of the country's transmission lines are 25 years or older, nearing the end of a 50-to-80-year design life. The American Society of Civil Engineers graded US energy infrastructure a D+ in its 2025 Infrastructure Report Card, down from C- in 2021. There are roughly 600,000 miles of transmission and more than 5.5 million miles of distribution line to keep standing, carried on over 180 million poles.
When that infrastructure fails, the bill is large:
- $67 billion a year - the average annual cost of major outages to US customers, 2018 to 2024, per Oak Ridge National Laboratory.
- $121 billion - the cost in 2024 alone, a single-year record.
- 80% of major US outages from 2000 to 2023 were weather-related (Climate Central's analysis).
Weather earns most of the blame. But it is rarely the whole story. Roughly 40% of the county-days with outages of eight hours or longer happened with no severe-weather event at all, according to peer-reviewed outage research - the kind of failure that traces back to a component that was already weak.
That is the part you can do something about. A storm is not optional. A corroded connector that has been getting worse for a year is. Waiting for a part to fail is the most expensive way to maintain a grid - emergency repairs and unplanned outages cost far more than the planned fix would have, which is the real cost of reactive maintenance. What follows is how the defects that drive those failures behave - and where AI inspection software changes the outcome. Catch those weak components early and it shows up directly in your reliability numbers - fewer sustained interruptions, lower SAIDI - which is how AI inspection improves grid reliability over successive cycles.
What is the grid in a power system - and where do outages start?
The grid is the connected system that moves electricity from where it’s generated to where it’s used: generation feeds high-voltage transmission lines that carry power between regions, substations step the voltage down, and the electrical distribution network - the poles and lines along streets - delivers it to customers. When people say “the electrical grid,” they usually mean all three layers at once.
Outages don’t start evenly across those layers. Over 90% of customer outages begin on the distribution system (US Department of Energy) - it has the most equipment, the most exposure, and the closest contact with trees, vehicles, and weather. The hardware carrying that risk is mundane: the wood poles, crossarms, and small line hardware covered in our guide to utility poles. Electric power distribution fails retail, one component at a time; transmission fails wholesale - rarely, but with consequences measured in whole regions.
That asymmetry is why outage prevention is an inspection problem twice over: distribution needs coverage at enormous scale, and transmission needs component-level certainty on every structure.
How does a grid asset defect become an outage?
Most equipment-driven outages do not arrive out of nowhere. They start small and visible - a rust bloom eating into a steel member, a hairline crack in an insulator, a clamp backing off a bolt. The defect gets worse over months until the part finally lets go.
The failure is sudden. The defect was not. And that gap is the opening: if a defect is visible in an image today, it was visible last month too. The only questions are whether anyone was looking, and whether they knew it mattered.
Common power line defects that cause outages
Here is how the everyday visible defects turn into outages:
| Visible defect | What it becomes | The outage it causes |
|---|---|---|
| Corrosion or section loss on a steel member or conductor | Loss of strength, then a break | Conductor down, sustained outage |
| Cracked or contaminated insulator disc | Flashover under load or in wet weather | Fault and breaker trip |
| Loose or missing hardware - bolts, clamps, fittings | Component shifts, then drops | Phase fault, dropped conductor |
| Encroaching vegetation | Contact with an energized line | Fault, and ignition risk |
| Overheating connector (a thermal hotspot) | Connector failure | Localized outage, fire risk |
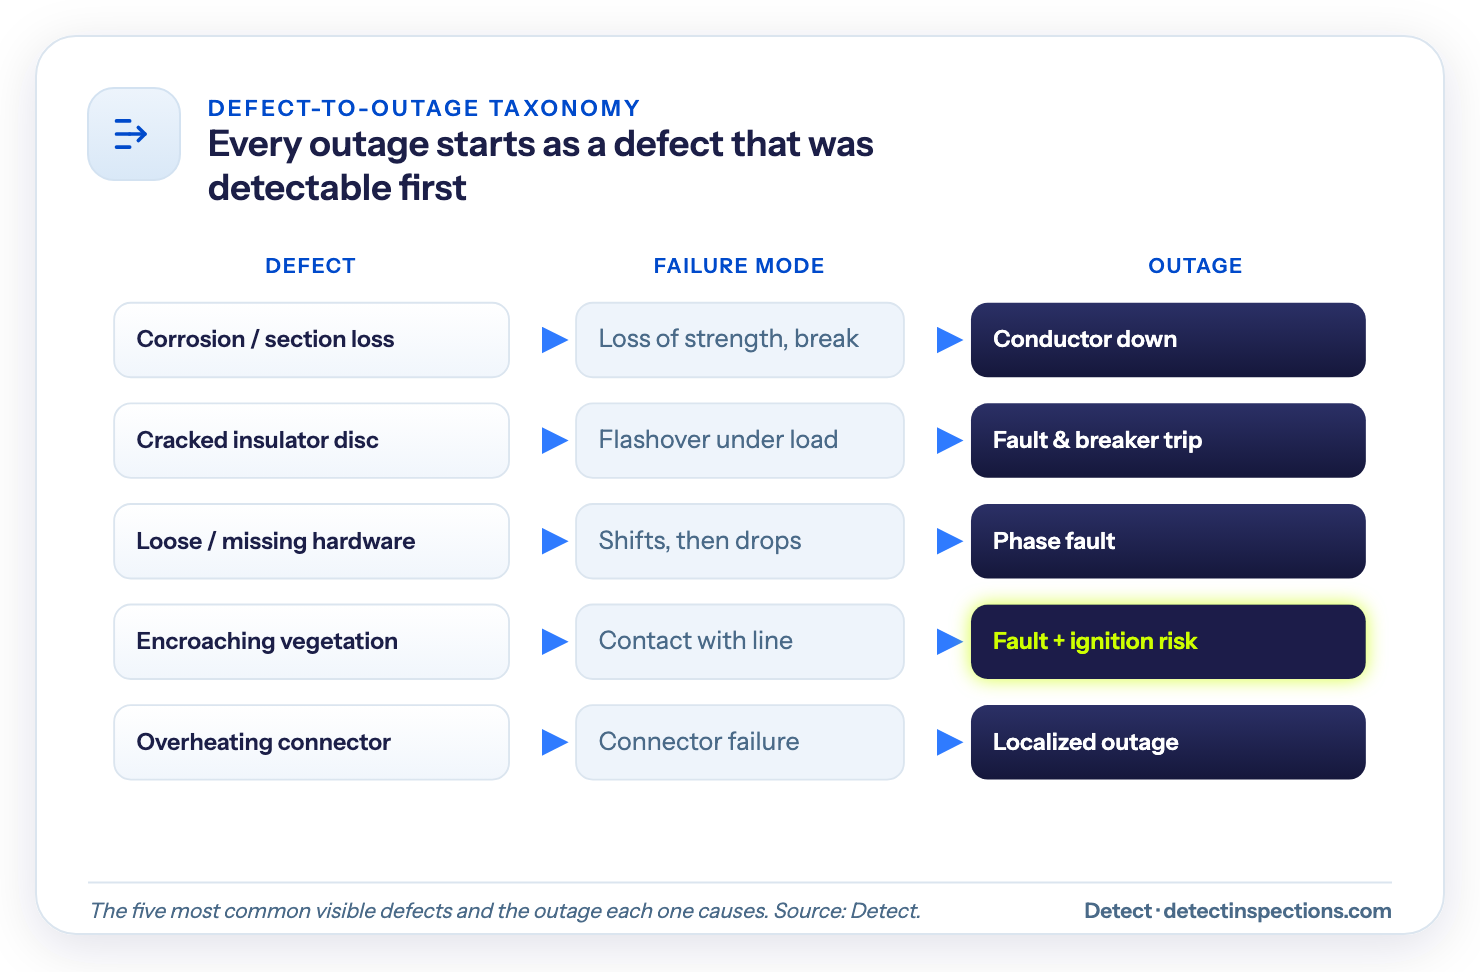
None of these are exotic. They are the conditions your crews already know by name. A mature catalog covers far more - Detect's transmission catalog runs to 258 defect types across 19 component classes. Nearly all of them trace back to a short list of common grid failure causes - aging hardware, weather stress, and deferred maintenance compounding on the same structure. The point here is simpler: every row in that table was a defect that was detectable before it was an outage.
What is the Failure Window?
Every asset-driven outage moves through three phases. The span between the first and the last is the Failure Window - and outage prevention is the work of acting inside it.
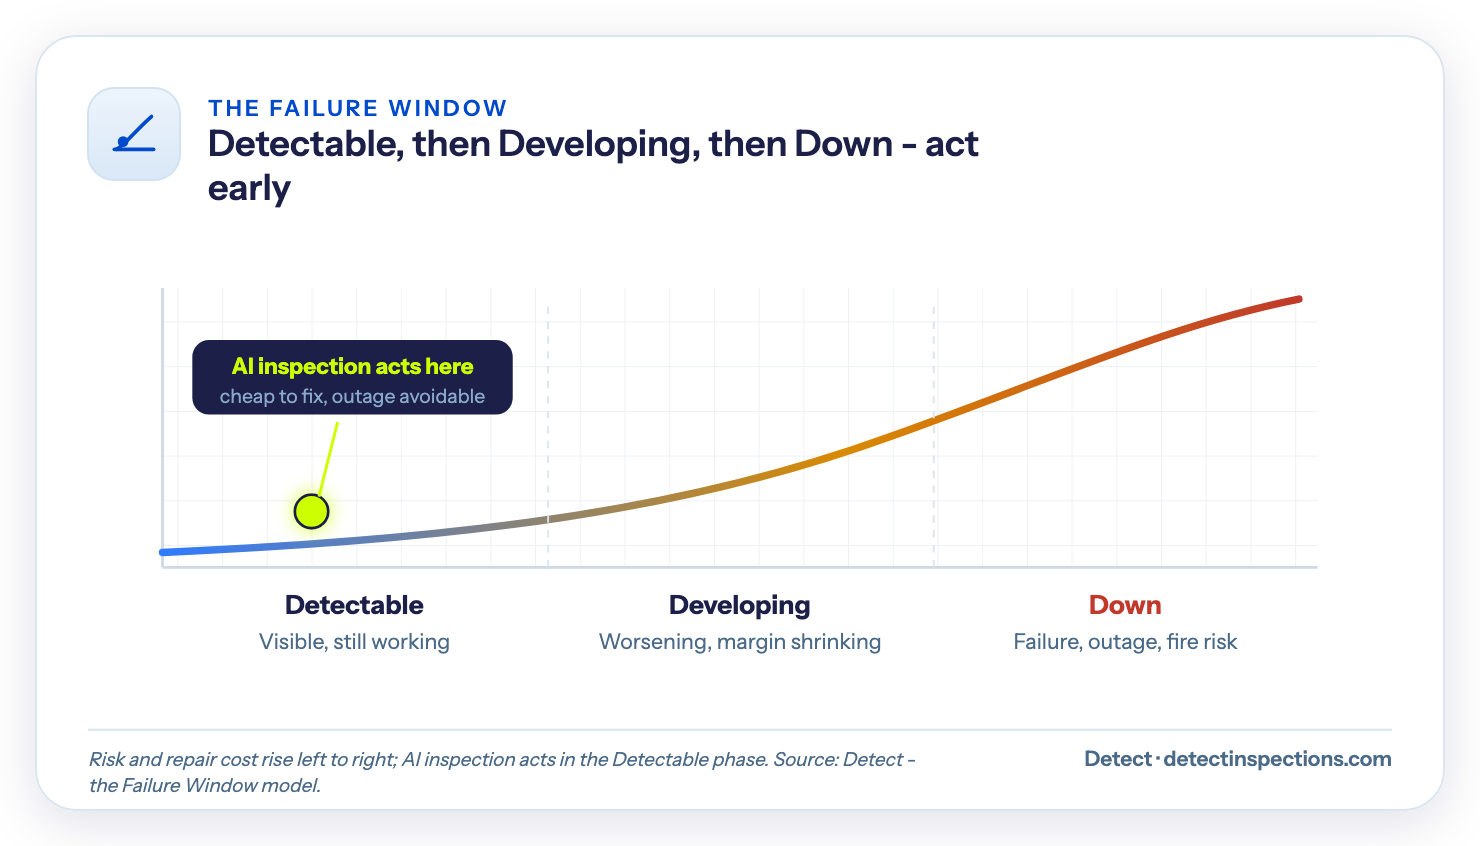
- Detectable. The defect is visible in imagery - a crack, a rust bloom, a loose fitting - but the asset is still doing its job. Action is cheap. The outage is still avoidable.
- Developing. The defect is getting worse. Strength is dropping, a hotspot is climbing, vegetation is closing the gap. The margin is shrinking.
- Down. The component fails. Now it is an outage, a crew callout, and in the wrong conditions, a fire.
The whole value of inspection is to catch the defect while it is Detectable and act before Down. The trouble is how narrow the manual window is. NERC's FAC-003 standard requires transmission lines to be inspected at least once a year, with a maximum interval of 18 months. California's General Orders set similar maximums for distribution - a detailed inspection only every five years in many areas. A defect can move from Detectable to Down in the gap between two manual inspections. No one sees it until the lights go out.
The Failure Window is yours to widen. The width of your Failure Window is set by two things you control: how often you capture imagery, and how fast you turn that imagery into a ranked finding. Everything else is the asset aging on its own schedule. Shorten both, and more defects get caught while a repair is still a repair - not an outage.
Tracking defects across inspection cycles
A single inspection tells you a defect exists. A series of them tells you how fast it is moving. This is where AI inspection software earns its keep: it makes every cycle comparable to the last.
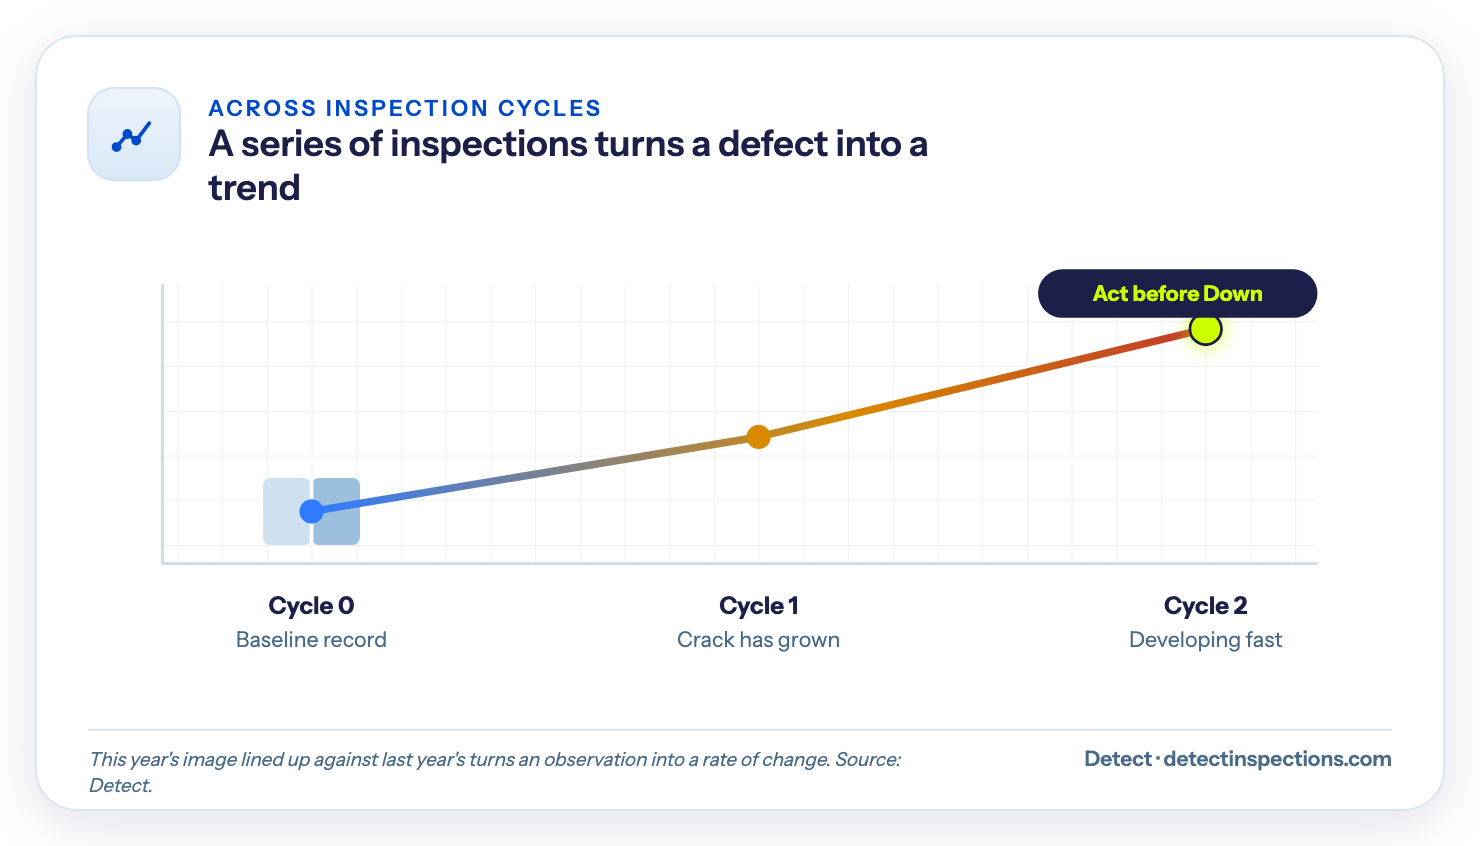
Treat the first full inspection as cycle zero - the baseline condition record for the line. Every inspection after that is measured against it. When the software lines up this year's image of a structure against last year's, a crack that grew or a connector running hotter stops being a single observation and becomes a trend. That before-and-after view is what turns "this is detectable" into "this is developing, and here is how fast."
It is also the strongest argument for consistent capture. You cannot compare images you cannot trust.
How does AI asset inspection prevent grid outages?
AI asset inspection for power grids prevents outages by doing four things at once that manual review cannot do at scale. None of them remove your experts. They aim them.
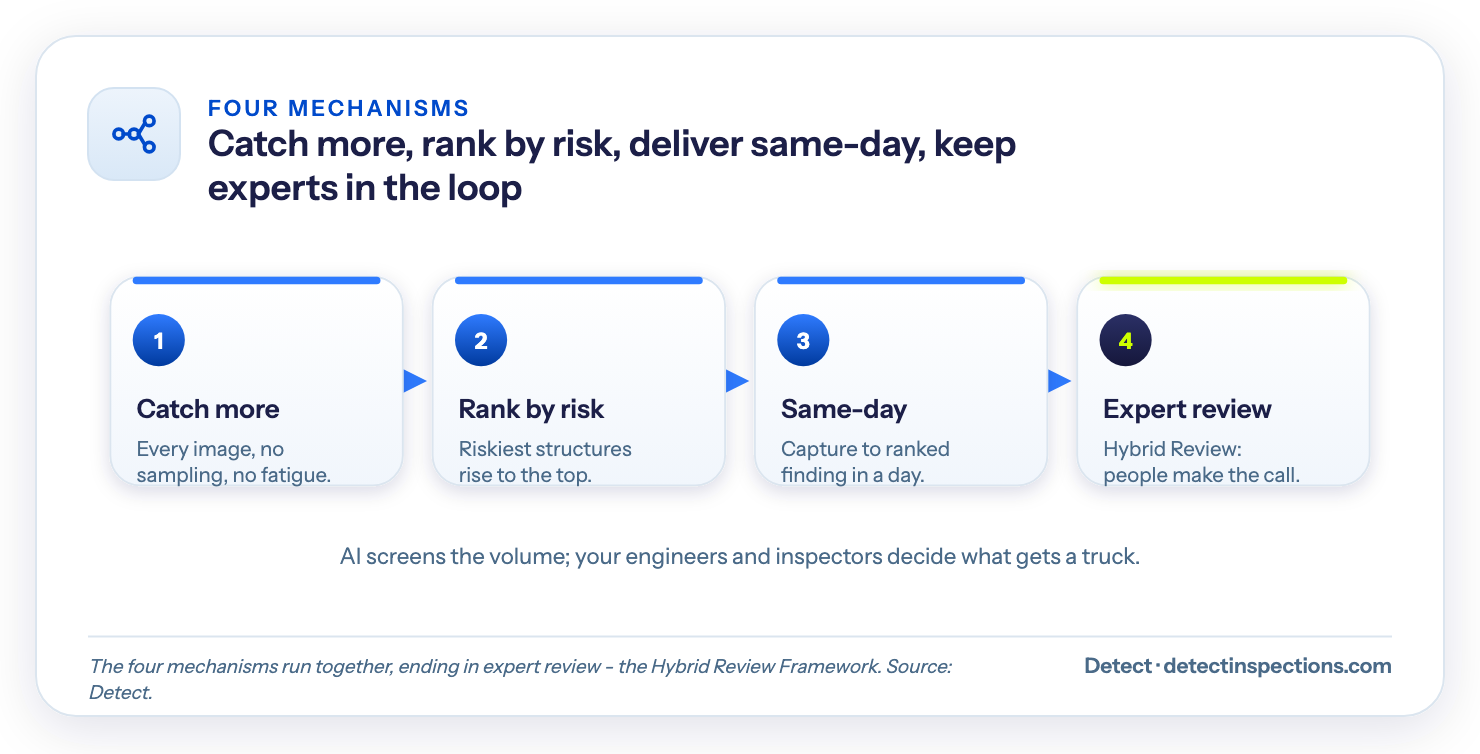
Catch more defects with AI visual inspection
Computer vision reads every image of every structure, not a sample, and it does not get tired on hour six of a corridor. The models behind these visual inspection platforms are trained on large libraries of real inspection imagery - EPRI's labeled image library, for example, sorts about 7,000 transmission-asset images into operational and defective to train AI defect detection.
What the model catches depends on capture quality. A sharp image makes the full defect catalog assessable. A blurry one leaves only the grossest problems visible. The gap is bigger than it sounds. In Detect's own programs, sharp capture makes the full defect catalog assessable; soft images drop that to about two-thirds, and blurry ones to roughly 7%. Capture quality sets the ceiling on outage prevention before the model runs at all. A model can only assess what the image actually resolves, which is the main reason AI inspections miss defects - blur, bad angles, and missing coverage, not the algorithm giving up.
What good capture looks like. Capture quality sets the ceiling on what any model can find. A blurry image of a failing insulator is a missed defect, not a caught one. Good capture means:
- Every face of every structure, not just the road-facing side.
- Consistent angles and overlap, so this cycle compares cleanly to the last.
- Thermal on connectors and splices, where a hotspot is the only early warning.
- Enough resolution to resolve a cotter pin, not just a crossarm.
Rank defects by outage risk
Finding thousands of conditions is not progress if your team cannot tell which ones will fail first. AI inspection scores each finding so the riskiest structures rise to the top of the list. Scoring each finding by severity and likelihood is the work of same-day AI triage: it turns thousands of conditions into a ranked list your crews can act on this week, not next quarter.
Deliver findings the same day
A defect found in an image that sits in a queue for three weeks is still a defect in the field. Cutting the time from capture to a ranked, reviewable finding to the same day means the Detectable phase is acted on, not just recorded. Because the AI handles the first read, the same crew can inspect ten times more assets - the limit becomes flight time, not how many people you can hire.
Keep experts in the loop
AI screens the volume. Your engineers and inspectors judge the findings that matter and decide what gets a truck. That is the Hybrid Review Framework - AI and expert review working together - and it is the difference between a model that flags things and a program a reliability team will stand behind.
From defect detection to failure prediction
Detection answers "what is wrong now." The harder, more valuable question for power grid maintenance is "how long until it fails." Time-based schedules cannot answer it - they inspect on a calendar, regardless of the asset's actual state, which EPRI notes "cannot be used to anticipate failures." Condition-based maintenance can, because it works from the asset's real condition.
Multi-cycle inspection data is what makes the shift possible. Once you can see how fast a defect is developing, you can estimate where it sits in the Failure Window and schedule the fix before Down, not after. The wider field is already moving this way: a 2024 EY analysis reports utilities using AI and integrated data to avoid roughly 40,000 outages over two months - predictive analytics on operating data, paired with the visual condition data inspection provides.
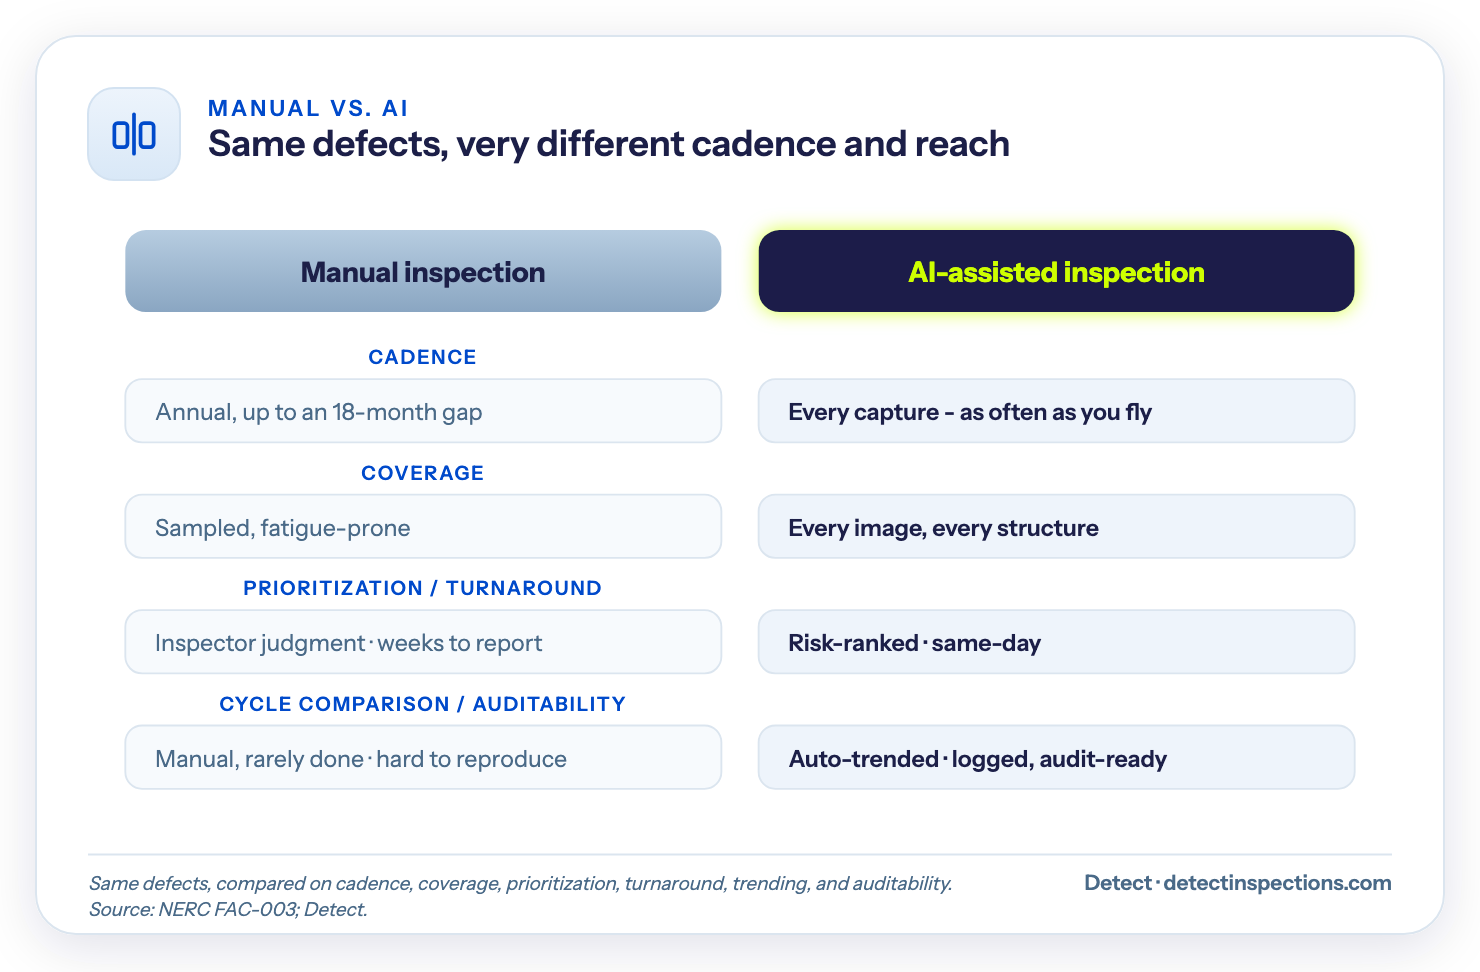
Manual vs. AI inspection: what actually changes?
Both approaches look for the same defects. What changes is how often you look, how much you see, and how fast you can act.
| Manual inspection | AI-assisted inspection | |
|---|---|---|
| Cadence | Annual, up to an 18-month gap (NERC FAC-003) | Every capture - as often as you fly |
| Coverage | Sampled, fatigue-prone | Every image, every structure |
| Prioritization | Inspector judgment, varies by person | Risk-ranked, consistent across the network |
| Turnaround | Weeks from capture to report | Same-day |
| Cycle-over-cycle comparison | Manual, rarely done | Automatic, defect trended over time |
| Auditability | Field notes, hard to reproduce | Logged, repeatable, audit-ready |
The takeaway is not that software replaces the inspector. It is that the inspector stops spending the day looking at healthy structures and spends it on the ones most likely to fail.
Does AI inspection work for distribution and transmission?
Yes, and it has to.
Over 90% of customer outages originate on the distribution system, where the asset count is enormous - more than 5.5 million miles of line and over 180 million poles. That is far more than any crew can hand-inspect on a tight cycle, which is exactly the volume problem AI is built for.
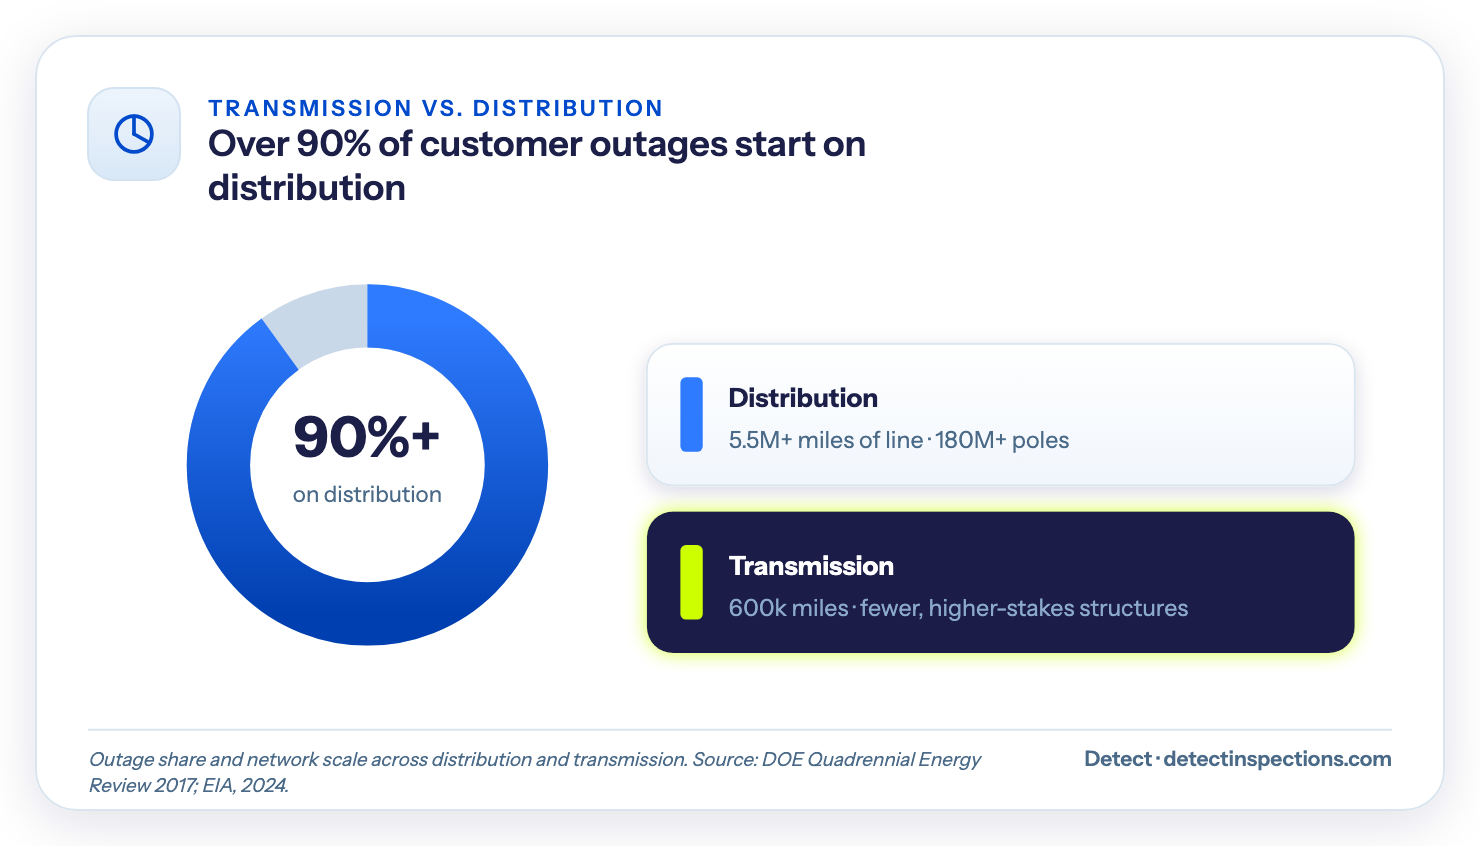
Transmission is the smaller, higher-stakes half. There are fewer structures, but a single failure can drop a region, and the assets are tall, remote, and expensive to climb. The same computer vision that screens a feeder pole reads a 345kV lattice tower. Transmission line inspection and HVDC transmission inspection differ in access and scale - the towers are taller and harder to reach - but not in the defects that take a line down. The defects differ in scale, not in kind, and the Failure Window logic holds on both.
How does AI inspection reduce wildfire and vegetation risk?
Wildfire is where a missed defect stops being an outage and becomes a catastrophe. It is the clearest case for inspecting early.
The tower that started the 2018 Camp Fire was a worn, nearly century-old C-hook on a PG&E transmission line. It snapped, the line arced, and the fire killed 85 people and burned about 153,000 acres. The tower had not been climb-inspected since 2001. A proper inspection, the CPUC concluded, "could have identified the worn C-hook before it failed and prevented ignition." The defect sat in the Detectable phase for years. No one was looking.
What causes utility wildfire ignitions
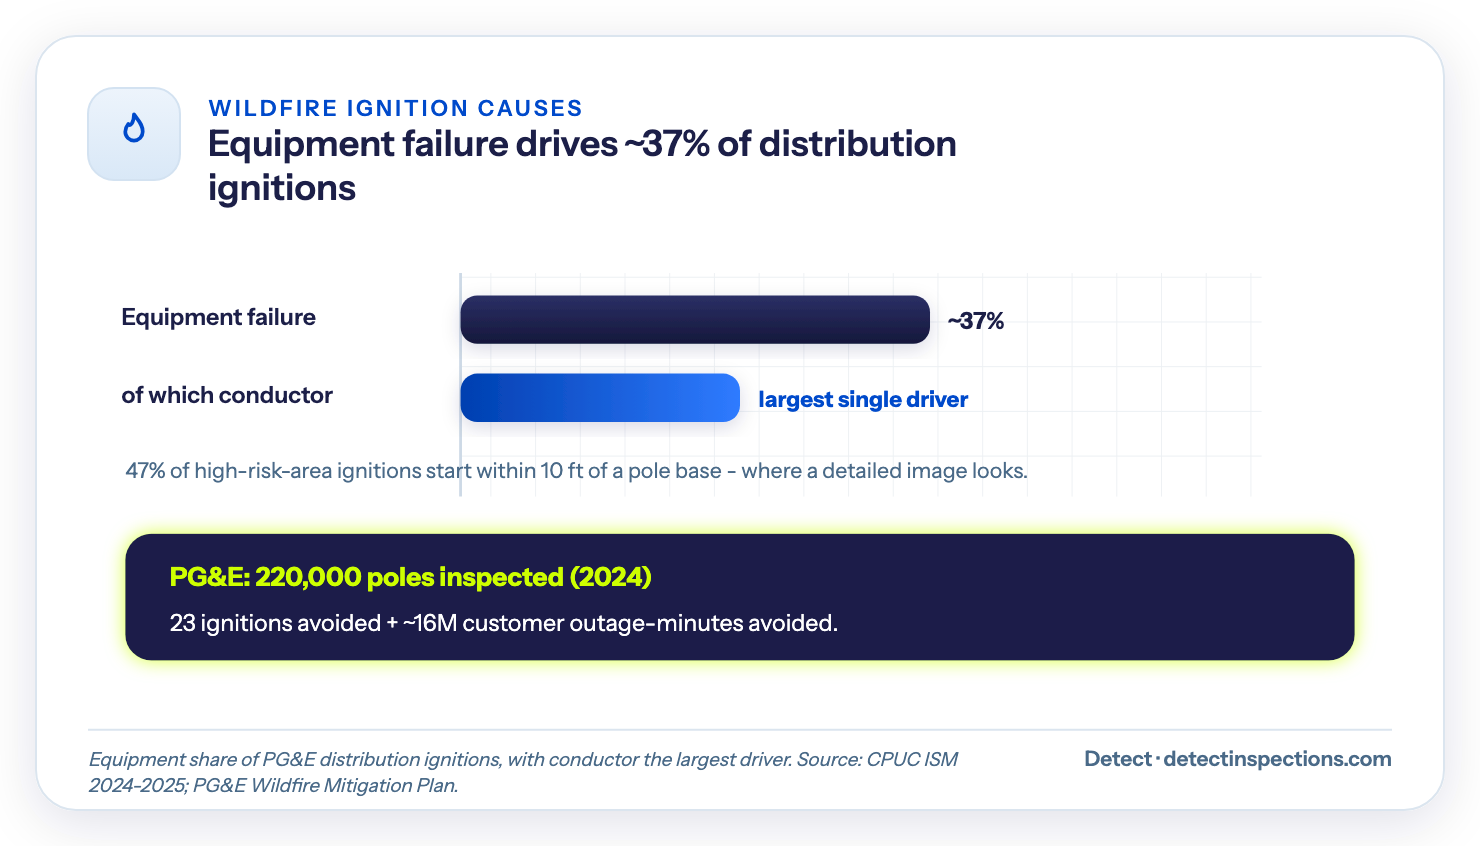
The causes are not a mystery, which is what makes them inspectable. Equipment failure accounts for roughly 37% of PG&E's distribution ignitions over a recent five-year span, with conductor failures the single largest driver. Vegetation contact and equipment hardware - splices, clamps, insulators - make up most of the rest. Nearly half of high-risk-area ignitions started within ten feet of a pole base, drawing on CAL FIRE's investigation records and CPUC reporting - exactly where a detailed image looks.
How better inspection data shrinks ignition and PSPS risk
The regulatory weight here is heavy. California's investor-owned utilities planned more than $23 billion in wildfire-mitigation spending for 2023 to 2025, and General Orders 95 and 165 set the inspection cadence they have to meet.
The payoff is now measurable. PG&E drone-inspected about 220,000 poles in 2024 and, in its mitigation reporting, credits its expanded program with avoiding 23 ignitions and roughly 16 million customer outage-minutes.
Better condition data also reframes the bluntest instrument utilities have: the Public Safety Power Shutoff. A single October 2019 event cut power to about 800,000 customer accounts. The more precisely you know which spans are dangerous, the fewer you have to de-energize. A compliant Wildfire Mitigation Plan now has to document inspection cadence, vegetation clearance, and PSPS criteria - and inspection data is what feeds all three.
What to look for in an AI inspection platform
If the goal is preventing outages - not just generating a report - judge visual inspection platforms on what actually shortens the Failure Window:
| Criterion | Why it matters | What good looks like |
|---|---|---|
| Defect accuracy | A tool that misses the defects that cause failures is worse than none | High recall on outage-driving defects, verified by experts, not a raw model score |
| Risk-based prioritization | Thousands of findings are noise without a fail-first order | Each finding scored by severity and likelihood, ranked into a work plan |
| Same-day turnaround | A defect found weeks late is still in the field | Ranked, reviewable findings the day of capture |
| Capture flexibility | Re-flying to fit the software wastes the budget | Drone, helicopter, ground, even a phone photo - across transmission and distribution |
| Cycle-over-cycle comparison | One pass finds a defect; a series shows how fast it is moving | Automatic change detection against a baseline |
| Centralized data | Multiple contractors and regions fragment the record | One system that centralizes multi-contractor, multi-region inspections |
| Integration and access control | Findings that never reach the work-order system never get fixed | EAM/CMMS integration (Maximo, SAP, Esri), plus role-based access and audit logging |
Most platforms stall on workflow fit rather than model accuracy - the practical reason utilities struggle with these tools. And in procurement, data quality increasingly outweighs price in how utilities evaluate vendors.
Change the denominator. The useful question is not "what does inspection cost per structure." It is "what does a usable finding cost, and what did that finding save." A $15,000 planned repair flagged early beats a $150,000 forced outage every time. Price the outcome, not the flight. Measured against avoided outages, the return on AI inspection ROI is set by how many findings you can actually act on.
What outage prevention looks like in practice
The case for acting early is easiest to see on a real line.
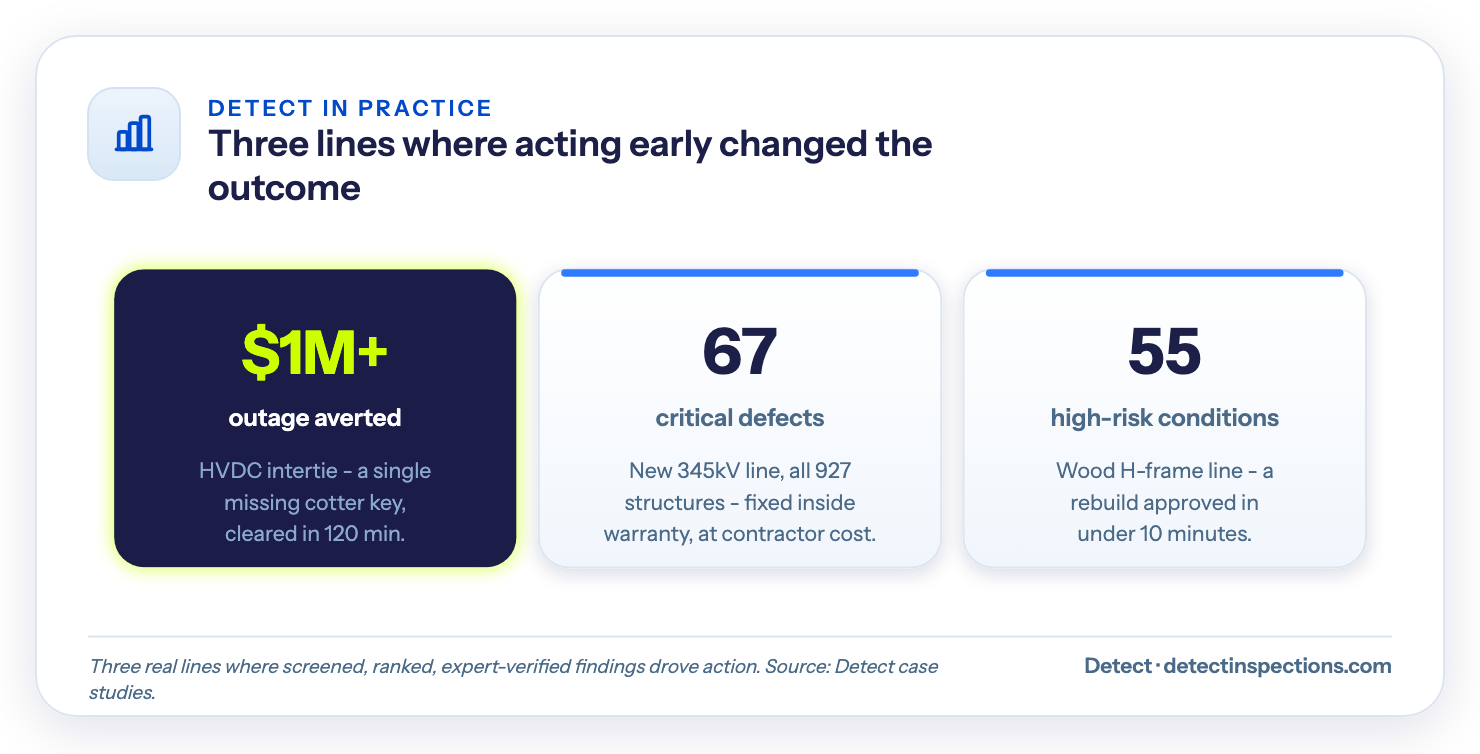
Preventing a $1M transmission outage
On a roughly 250-mile HVDC intertie carried by about 2,600 lattice towers, AI-assisted inspection flagged a single missing cotter key from the imagery. Left in place, that small part can drop a conductor and force an outage.
It was cleared in 120 minutes of field time. The catch averted more than $1 million in forced-outage costs - one finding out of 1,270 flagged across 122,000 images, reviewed in 30 days by a three-person team.
Catching defects at commissioning
The same discipline shows up before a line is even energized. On a new 345kV line, evidence-driven inspection covered all 927 structures - 65,701 images, 73% more scope than planned, with zero schedule slip - and produced an image-linked defect register inside 72 hours.
It surfaced 67 critical defects. And 13,004 critical and high-priority findings were corrected at the contractor's cost while the line was still under warranty. Caught after energization, those same defects would have been the utility's problem - and some would have been outages.
Funding a rebuild on aging wood
On a wooden H-frame line replacement, a single field day across 96 structures surfaced 55 high-risk conditions across two lines. That gave the asset committee what it needed to approve a multi-million-dollar rebuild in under ten minutes.
None of this is the AI acting alone. It is a screened, ranked, expert-verified record - the kind of audit-ready output that pairs with a strong security posture, including SOC 2 Type II compliance.
How does grid modernization change outage prevention?
Grid modernization adds intelligence to the network - line sensors, automated switching, advanced metering, and distributed energy resources like rooftop solar and batteries. It changes outage prevention in two directions at once. Automation shortens outages that still happen: faults get isolated and rerouted in seconds. And DERs raise the stakes on condition: power now flows both ways through equipment that was engineered for one, and every interconnection is another node where a hardware defect matters.
What modernization doesn’t do is renew the structures the new equipment hangs on. A feeder can carry smart switching on a pole that’s been in the ground since the 1970s. That’s why inspection belongs in every modernization program: the condition baseline tells you which parts of the network can carry the new load and the new duty cycle - and which need work before the upgrades go up. Modern monitoring watches the electrons; visual inspection watches the iron.
Where to start AI asset inspection on your grid
The grid is aging, reliability is sliding, and most of the outages those trends produce begin as a defect someone could have seen. AI inspection software does not change the assets. It changes how early you see the problem, how clearly you can watch it develop, and how fast you act - inside the Failure Window, while the fix is still cheap and the outage is still avoidable.
- Begin with your highest-risk corridors - oldest assets, fire-prone spans, critical load.
- Run the imagery you already have through AI screening before you fly anything new.
- Set a risk threshold that decides what gets a truck this quarter versus next.
- Push findings into your existing work-order system, not a separate spreadsheet.
- Treat this first pass as cycle zero - the baseline every future inspection is measured against.
Run the AI inspection ROI for utilities for your own network and the planned-repair-versus-outage math usually makes the call for you. When you are ready to test it on your own network, book a free audit.
Test it on your own network
DetectOS reads the drone, helicopter, and ground imagery you already collect, finds defects against a 258-type catalog, ranks them by outage risk, and returns expert-verified findings the same day - across transmission and distribution. Act inside the Failure Window, before a defect becomes an outage.
Book a free audit →