
From Image to Work Order: How Inspection-to-Maintenance Orchestration Works
Utilities are good at collecting inspection imagery. The hard part is what happens next - and most programs still leave it to file shares, spreadsheets, and re-keying.
- Most inspection programs don't fail at finding defects. They fail at turning findings into scheduled work.
- Orchestration runs five stages inside a single inspection cycle - capture standard, quality gate, AI screen, expert review, work order - and a sixth, verification, on the cycle after.
- Capture quality decides everything downstream: sharp imagery makes 100% of a 258-type defect catalog assessable; blurry imagery, 7% (Detect Data Quality Program).
- Findings should land in Maximo, SAP, or Esri workflows as structured, georeferenced records - not as PDF reports someone re-keys.
What is inspection-to-maintenance orchestration?
Inspection-to-maintenance orchestration is the layer of process and software that carries a defect from the image where it was captured to the work order that fixes it - without losing evidence, location, or priority along the way. It is not a camera, not a detection model, and not a maintenance system. It is what connects them.
Every utility already owns pieces of this span. Drone programs and contractors produce imagery. Analytics tools flag conditions. An EAM or CMMS schedules the work. What most utilities do not own is the connective layer - the thing that guarantees a flagged crack on structure 214 arrives in the maintenance queue as a verified, ranked, georeferenced record rather than a JPEG in a shared folder.
That layer is where inspection value is either delivered or lost. A finding that never becomes a work order costs as much to capture as one that does. Orchestration exists to make sure you act on what you paid to see: decision-grade grid intelligence from every image, across your entire network. You can see how Detect structures this span on how DetectOS works.
Why do inspection findings fail to become maintenance work?
Because imagery, asset records, and maintenance systems are disconnected - and findings die in the gaps between them. The failure is rarely the AI. It is the plumbing.
The gaps are measurable. Across the industry, 15-25% of delivered inspection imagery gets reworked; a standardized capture workflow cuts that to 3-7% within two campaigns (Detect, State of Utility Drone Inspections 2026). The single largest driver of that rework is GPS misassociation - images tied to the wrong structure - which accounts for 35% of it. A photo of the wrong pole is not a finding. It is a liability.
Quality compounds the problem. Against Detect's 258-type, 19-class defect catalog, sharp imagery leaves 100% of defect types assessable. Soft imagery drops that to 69%. Blurry imagery, 7% (Detect Data Quality Program). A capture decision made in the field quietly decides what your maintenance planner will ever get to see. The clock compounds it: failure modes keep developing between inspection cycles, so a finding that stalls in a queue can be overtaken by the failure it flagged.
These are the same failure modes that make platforms feel hard to adopt - why utilities struggle with visual inspection platforms is mostly a data story, and the five data-quality failures that sink inspections show up before any model runs. Orchestration treats those failures as the first problem to solve, not an onboarding surprise.
What are the six stages between an image and a work order?
Five stages run inside a single inspection cycle: capture standard, quality gate, AI screen, expert review, and work order. The sixth - verification - happens a cycle later, and it is what turns a pipeline into a loop.
The five in-cycle stages are the same pipeline we describe in our guide to visual predictive maintenance for grid assets. What matters for orchestration is who acts at each stage, and what artifact moves between systems when they do.
Who acts at each stage of the pipeline?
A different person owns each handoff, and orchestration works because none of them has to chase the others.
- Capture standard - the pilot or field crew. Shot sheets and capture specs define what a usable image is before anyone flies. The standard is the contract.
- Quality gate - the platform. Every image is checked for sharpness, coverage, and correct structure association before analysis. Imagery that fails goes back for recapture now, not after the report ships.
- AI screen - the models. AI screens the full volume and clears the noise, so the images that need human eyes get them.
- Expert review - Detect's reviewers. Every flagged condition is verified by a person before it becomes a finding. This is the Hybrid AI + Expert Review model: AI screens the volume, experts stand behind the findings.
- Work order - the utility's planner. Verified findings arrive ranked by severity and criticality, so the planner's question is "which crew, which week" - not "is this real."
- Verification - the next cycle. The following inspection re-images the same structures and confirms the fix. Found and fixed become two sides of one record.
What passes between systems at each handoff?
An artifact, not a promise. The capture standard hands the quality gate raw imagery with metadata. The quality gate hands the AI screen only imagery worth analyzing. The AI screen hands expert review a candidate set. Expert review hands the planner structured findings - image, location, structure ID, defect class, severity. And the work-order handoff gives the EAM a record it can act on without a human re-typing it.
When any handoff degrades into email attachments and tribal knowledge, the whole span slows to the speed of whoever is busiest that week. Orchestration is the discipline of making every handoff carry data, not conversation.
How does a verified finding become a work order in your EAM?
As a structured, georeferenced record - structure ID, coordinates, defect class, severity, and the evidence image - ready for the workflows your team already runs in IBM Maximo, SAP, or Esri ArcGIS. The orchestration layer does not replace those systems. It feeds them.
The utility data model matters here: findings that carry standards-aligned identifiers (the IEC 61968 CIM family) survive the trip into enterprise systems; PDFs do not. A report someone re-keys is a transcription error waiting for a storm.
Deciding which findings become this year's work program - and defending that program to regulators and rate cases - is its own discipline. Our guide to how AI inspection platforms guide utility planning covers that planning layer in depth; orchestration is what delivers it clean inputs.
How do you close the loop after the work order?
The next inspection cycle re-images the same structure and confirms the repair - which makes the inspection record permanent, comparable, and auditable instead of disposable. Most programs never do this. The work order goes out, the crew closes the ticket, and nobody looks at that crossarm again until something fails.
The regulatory floor makes the case for doing better. California's GO 165, for example, requires detailed overhead inspections only every five years - and a lot happens to hardware in five years. A closed-loop record means each cycle starts from evidence, not from zero: what was found, what was fixed, what changed since.
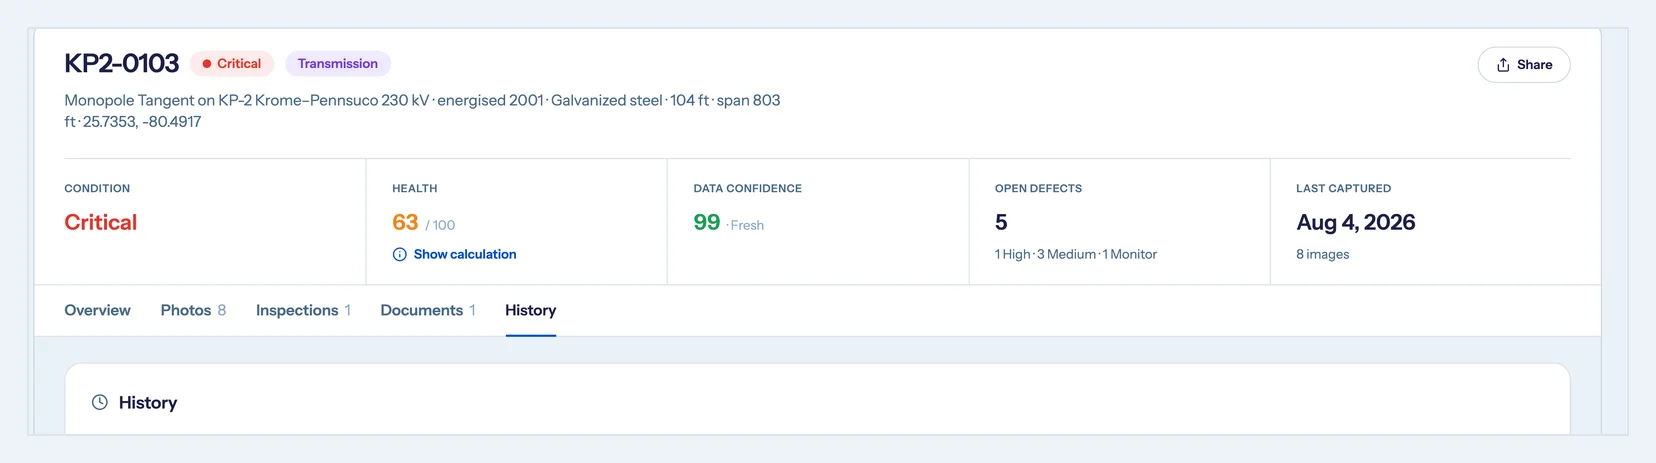
Every structure inspected this way leaves a permanent visual record - verifiable, comparable next cycle, ready for the regulator. Over cycles, that record becomes the condition baseline that utility asset management programs are supposed to be built on, and the found-versus-fixed trend becomes a health measure you can show a board.
How is orchestration different from inspection management software?
Generic inspection management software stops at the finding; capture platforms stop at the image; asset performance tools start at the sensor. Orchestration runs the span between capture and maintenance system, and stands behind what it hands over.
The categories are easy to confuse because they all say "inspection" - but they end in different places:
| Capture platform | Inspection management software | APM / CMMS | Orchestration layer | |
|---|---|---|---|---|
| Primary input | Flight plans, sensors | Forms, checklists, photos | Sensor and work data | Inspection imagery at scale |
| Primary output | Imagery | Completed inspections, reports | Schedules, work orders | Verified, ranked findings as work-order-ready records |
| Who verifies findings | Nobody - capture only | The inspector filling the form | Not in scope | Expert review on every finding |
| Where it ends | At the image | At the report | Inside the maintenance system | Inside your EAM, then back for verification next cycle |
| Enterprise handoff | File export | PDF / CSV | Native (it is the system) | Structured, georeferenced records built for the EAM |
| Closed loop | No | No | Work-order close only | Fix confirmed by re-inspection |
None of these categories is wrong - a utility usually needs several of them. The evaluation question is which layer owns the span between them. Our grid inspection AI scorecard gives you weighted criteria for that evaluation, and our review of the best AI inspection software for utilities names the platforms in the field.
How do you start?
- Adopt a capture standard first. Shot sheets, capture specs, and a defined quality bar. Everything downstream inherits this decision.
- Run a data remediation sprint. Fix structure IDs, reconcile the asset register against reality, and establish which imagery you already own is assessable.
- Map the integration blueprint. Decide, before the first campaign, exactly what record format lands in your EAM or GIS and who owns the handoff.
- Pilot on one line or region. Run the full span - capture through work order - on a bounded scope, and measure findings acted on, not images collected.
- Scale by rollout phase. Expand by territory or asset class with the standard, the blueprint, and the baseline already proven.
Each of these is a bounded piece of work with a clear exit - which is exactly how adopting an orchestration layer should feel.
See the span on your own network
Detect's free audit reviews a sample of your existing inspection imagery and tells you how much of it is assessable today - the first honest measure of how far you are from image-to-work-order.
Get a free audit