
Understanding Grid Resilience in Utility Asset Management
Resilience budgets are bigger than ever - and regulators have started asking a harder question: can you prove this spend targets the structures most likely to fail? That proof is asset condition evidence, and this guide shows how to build it.
- Resilience is not reliability. SAIDI and SAIFI are routinely reported with Major Event Days excluded under IEEE Standard 1366 - so strong reliability scores can coexist with poor storm performance.
- The stakes are compounding: roughly 70% of US transmission lines are 25 or more years old (DOE), and the average customer lost about 11 hours to interruptions in 2024, roughly 80% of them tied to major weather (EIA). Weather-driven outages cost an estimated $121 billion in 2024 alone (ORNL).
- Resilience money now comes with an evidence bar. Fourteen states and one city required utility resilience plans as of mid-2024 (Berkeley Lab), and regulators have begun trimming plans that look like deferred maintenance in a resilience wrapper.
- Resilience risk concentrates. On one new 345kV line, 76% of critical findings sat in a single segment - which is why evidence-targeted hardening beats blanket spend.
- Condition-First Resilience maps the four resilience capabilities - anticipate, absorb, adapt, recover - to the one input they all share: current, verified asset condition data at scale.
Every resilience conversation eventually hits the same wall. The plan says "harden the system." The budget asks "which structures, and why those?" Between the two sits a question most utilities cannot answer from their records: what condition is each asset actually in, today? This guide defines grid resilience the way regulators do, separates it from reliability, and shows how AI-assisted inspection turns resilience from a spending category into an evidence-backed program.
What is grid resilience?
Grid resilience is the power system's ability to withstand disruptive events and to reduce how severe and how long the resulting outages are. The most widely used formal wording is the definition federal regulators proposed in 2018: the ability to withstand and reduce the magnitude and/or duration of disruptive events, including the capability to anticipate, absorb, adapt to, and rapidly recover from such an event (FERC, Docket AD18-7, 2018).
Notice what the definition is really describing: four capabilities, not one construction project. Undergrounding a feeder is resilience work. So is knowing, before storm season, which 40-year-old structures are carrying defects that a design-load wind will finish off. The first is visible and expensive. The second is cheap by comparison - and it decides whether the expensive work lands in the right place.
That is why resilience belongs inside utility asset management rather than beside it. The asset register, the condition records, and the maintenance priorities are the raw material every one of the four capabilities draws on. A resilience strategy built on a stale or incomplete asset record is a guess with a budget attached.
Grid resilience vs grid reliability: what is the difference?
Reliability measures how consistently the grid performs on ordinary days. Resilience measures how the grid performs on the days that break things. The distinction is baked into how the industry reports its numbers. The standard reliability indices, SAIDI and SAIFI, are typically reported with Major Event Days excluded under IEEE Standard 1366. That statistical method strips out roughly the 2-3 most extreme days in a typical year, so everyday performance can be compared fairly.
That exclusion is reasonable for benchmarking. It also means a utility can post excellent reliability numbers while its storm performance deteriorates, because the days resilience is about are precisely the days the headline metrics set aside. Reliability work and resilience work overlap - a cleared defect helps both - but they answer different questions.
| Grid reliability | Grid resilience | |
|---|---|---|
| The question | How often does the power go out on a normal day, and for how long? | When a major event hits, how much fails, and how fast is it restored? |
| Events covered | Day-to-day interruptions; Major Event Days usually excluded (IEEE 1366) | High-impact, low-frequency events: hurricanes, ice, wildfire, heat |
| Core metrics | SAIDI, SAIFI, MAIFI | No single standard; event-based restoration and impact metrics |
| Typical work | Maintenance, vegetation cycles, protection schemes | Hardening, undergrounding, sectionalizing, targeted replacement |
| Asset data role | Schedule-driven upkeep | Condition evidence decides where hardening money goes |
The reliability side of this story has its own playbook - including why reliability is a turnaround problem as much as an equipment problem. This guide stays on the resilience side: the high-impact days.
Why is grid resilience urgent in 2026?
Because the three curves that drive it - asset age, weather severity, and outage cost - are all moving the wrong way, while unprecedented money arrives to fix it under unprecedented scrutiny.
The assets are old. Roughly 70% of US transmission lines are 25 or more years old (DOE). Age alone does not condemn a structure - but it widens the gap between what the record says and what is actually hanging on the steel. What "past design life" means in practice is its own subject: here is what happens when assets age past their design life.
The weather is doing more damage. The average US customer experienced about 11 hours of power interruptions in 2024, and roughly 80% of those hours traced to major weather events (EIA, Dec 2025). Oak Ridge National Laboratory puts the cost of weather-driven outages at about $67 billion per year on average - and $121 billion in 2024 (ORNL, Mar 2026).
The money has arrived - with strings. The federal Grid Resilience and Innovation Partnerships (GRIP) program carries $10.5 billion across FY22-26, with more than $6 billion announced in its first two rounds. The Section 40101(d) formula program adds $2.5 billion in grid resilience grants through states, territories, and tribes (DOE Office of Electricity). As of June 2024, fourteen states and one city required their utilities to file formal resilience plans (Lawrence Berkeley National Laboratory, July 2024).
And the scrutiny has arrived with it. In 2026, Texas regulators approved CenterPoint's multi-year system resiliency plan at roughly $2.7 billion - after trimming it. One commissioner objected that some proposed measures looked like replacing equipment at the end of its useful life rather than resilience investment (Utility Dive, 2026). That objection is the new reality in one sentence: regulators now ask utilities to prove the difference between hardening and catch-up maintenance. Condition evidence is how you prove it.
What goes into a grid resilience plan?
A grid resilience plan documents three things: which hazards and assets are vulnerable, which programs will reduce that vulnerability, and what those programs cost. Berkeley Lab's national review of state requirements distills the common structure to exactly that - a vulnerability assessment, a description of proposed resilience programs, and projected costs and rate impacts (LBNL, July 2024).
The program options are well mapped. Vegetation management, structure hardening, covered conductor, undergrounding, and sectionalizing each buy different protection at very different prices - our wildfire guide compares those hardening strategies in depth, because wildfire plans are where the trade-offs are most mature.
The weak link is almost always the first section. A vulnerability assessment is only as good as the asset knowledge underneath it. Hazard maps and climate projections are available to everyone; your structures' actual condition is not. When the assessment runs on design specs and age bands instead of current condition, the plan inherits every blind spot in the record - and the budget gets allocated by assumption. This is where inspection stops being a maintenance chore and becomes the foundation of the resilience case.
What is Condition-First Resilience?
Condition-First Resilience is a simple test Detect applies to resilience planning: take the four capabilities in the regulatory definition - anticipate, absorb, adapt, recover - and ask what evidence each one actually requires. All four turn out to need the same input: current, verified, structure-level condition data. You cannot harden what you have not assessed.
Anticipate asks which assets fail under the next stress event. Answering it takes a risk-ranked condition baseline that is current - and, increasingly, a predictive read on where degradation is heading, which is what happens when inspection imagery becomes a failure forecast.
Absorb asks whether the weakest structure in the path of the event will hold. Most of the time that is not a design question - it is a defect question, because the chain from small defect to grid outage runs through hardware that was already compromised before the weather arrived.
On a newly built ~250-mile HVDC intertie (~2,600 lattice towers), a 30-day inspection campaign in the line's first operating season put about 122,000 images through AI screening with a three-person team. The AI flagged 1,270 for expert review. One confirmed finding - a clevis bolt backed off, its cotter key missing - was cleared in 120 minutes of field work. The line had been commissioned in spring; engineering judged the defect would have taken it down under winter load, a forced outage the operator valued at more than $1M.
Source: Detect Data Quality Program, 2026.
Adapt asks whether the plan updates when the grid and the hazards change. In practice that means re-inspection cycles that re-rank risk - and a pipeline that turns fresh findings into risk-ranked, costed work plans executives can fund without translation.
Recover asks how fast you can prove what broke, where, and how badly. Crews, regulators, insurers, and warranty claims all consume that proof. A pre-event condition baseline is what turns post-storm chaos into comparison - the full workflow lives in our guide to utility storm damage assessment.
Where should grid hardening investment go first?
Wherever the condition evidence says risk concentrates - because it does concentrate, far more than planning assumptions expect. Spreading hardening budget evenly across a service territory feels fair and defensible. The field data says it overspends on healthy assets and underspends on the clusters that actually threaten the system.
76% of the critical findings on one newly built 345kV line sat in a single construction segment. That segment held 69% of the structures but produced far more than its share of the worst defects. 51 of 67 criticals, from 45,335 total findings across 927 structures. Same design, same spec, different build crews and conditions.
Source: Detect / CompassData 345kV case study, 2026.
Concentration is also what makes the funding case. On two aging wooden H-frame transmission lines, a 3-person crew captured 100% of the 96 structures in a single field day. Expert-reviewed analysis flagged 55 high-risk conditions - 35 on one line, 20 on the other - and the evidence-rich report moved the asset owner to fund a complete rebuild of both lines. Decades of deferred "we should look at those lines someday" became a funded resilience project, because the condition evidence made the risk undeniable (Detect wooden H-frame case study).
That is the pattern worth internalizing: resilience budgets move when the evidence is specific. "Our structures are aging" funds a study. "55 high-risk conditions, photographed, severity-ranked, on these 96 structures" funds a rebuild.
How do AI inspection platforms support grid resilience?
By making current, verified condition data possible at grid scale - which manual review of inspection imagery cannot deliver inside a planning cycle. The HVDC campaign above is the scale argument in miniature: about 122,000 images in 30 days with a three-person team, because AI screened the volume and experts judged the 1,270 images that deserved human eyes.
How does AI inspection find aging-infrastructure risks earlier?
Three mechanisms matter more than the model itself. First, coverage: AI-assisted analysis makes it economical to assess every structure, not a sample - and defects cluster, so samples mislead. Second, consistency: a defect catalog applied identically across the fleet (Detect's transmission catalog runs to 258 defect types across 19 component classes) turns scattered observations into comparable records. Third, capture quality control: on a sharp capture, 100% of that catalog is assessable; on a soft capture, 69%; on a blurry one, 7% (Detect Data Quality Program, 2026). The fastener-level defects that matter most for resilience - cotter keys, bolts, splices - vanish from assessment first when capture quality slips. A vulnerability assessment built on unscored imagery quietly caps itself without anyone noticing.
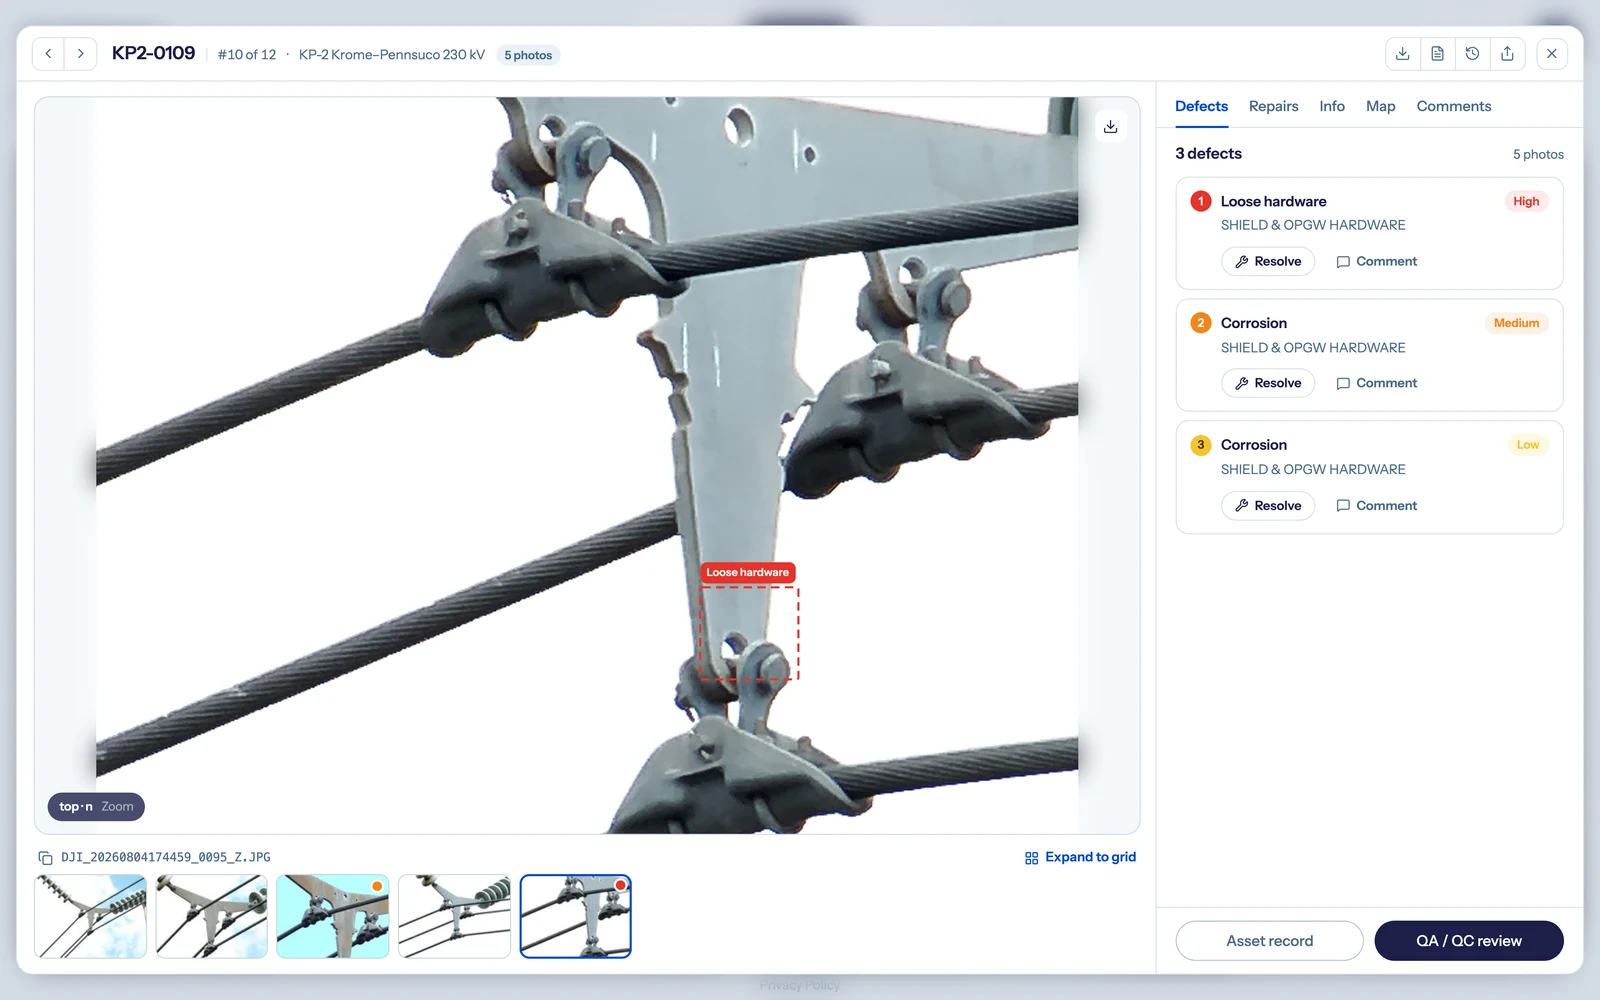
The unit of resilience evidence: one structure, its findings, severity, review status, and photo proof in a single record. Shown in a DetectOS demo environment.
Can AI replace expert judgment in resilience decisions?
No - and a resilience program is exactly the wrong place to pretend otherwise. Unreviewed AI detections carry false positives, and a hardening budget allocated on noisy findings is just a different flavor of guessing. The working model is hybrid: AI screens the volume, trained utility inspection experts confirm severity on what it flags, and only validated findings carry weight in the risk ranking. That validation is also what makes the record defensible when a regulator or insurer asks why you hardened these structures and not those. The findings then have to land where decisions happen - which is why findings must reach EAM work orders, GIS condition layers, and the reliability models, not another dashboard.
How is grid resilience measured?
There is no single standard metric - and that is an honest answer, not an evasion. Utilities and researchers currently measure resilience three ways, and a credible program borrows from each:
- Reliability indices, reported with major events included. SAIDI and SAIFI with and without Major Event Days, plus the count of MEDs per year. The gap between the two views is a rough resilience signal (IEEE 1366 method).
- Event-based performance metrics. Restoration-speed targets for major events - for example, the share of customers restored within 12 hours of losing power, a storm metric ComEd reports publicly (CIGRE US National Committee, 2022).
- Resilience-curve analysis. Research methods that trace an event's full arc - depth of the performance drop, duration, and recovery rate - mostly used in planning studies today.
All three measure outcomes after the fact. An asset program adds the leading indicators only condition data can supply: the share of the fleet with a current condition baseline, the count of critical findings cleared before storm season, and the lag from image capture to completed work order. Those are the numbers that predict the outcome metrics - and the ones a resilience plan can commit to improving next quarter, not next decade.
How do you build condition evidence into a resilience program?
Start where the vulnerability assessment is weakest and work toward the budget. Five steps, in the order that compounds:
- Pick the circuits that matter most. Start with the lines where a failure is costliest - critical load, wildfire exposure, long restoration times - not the ones easiest to fly.
- Establish a condition baseline with scored capture. Inspect every structure on those circuits, with image quality graded at ingest so the assessment's ceiling is known, not assumed.
- Risk-rank with expert-validated findings. Let AI screen the volume; have experts confirm severity. The ranked list of validated criticals IS the draft hardening plan.
- Clear the criticals before the season that tests them. Fixing a known weak point ahead of the stress event is the highest-return resilience spend available.
- Re-inspect on a cycle and measure the trend. Track baseline coverage, criticals cleared pre-season, and capture-to-work-order lag - the leading indicators behind the outcome metrics.
None of this replaces hardening programs, vegetation work, or undergrounding. It sequences them - so each dollar lands on evidence instead of assumption, and so the plan survives the regulator's new favorite question.
The bottom line
Grid resilience is the grid's capacity to anticipate, absorb, adapt to, and recover from the events that reliability metrics set aside. Every one of those capabilities runs on the same fuel: current, verified, structure-level condition evidence. The utilities winning resilience funding in 2026 are not the ones with the biggest asks. They are the ones who can show, structure by structure, where the risk lives and what it costs to remove.
That is the standard Detect builds for: decision-grade grid intelligence from every image, across your entire network - so your resilience plan is an evidence document, not a spending wish list.
See where your resilience risk concentrates
Send us imagery from a recent inspection campaign. DetectOS will grade its quality, run AI analysis with expert review, and show you the risk-ranked condition evidence your next resilience filing needs.
Book a free audit →