
What Happens When 70% of Transmission Structures Pass Their Design Life?
In its 2025 Report Card, the American Society of Civil Engineers downgraded U.S. energy infrastructure from a C- to a D+.
That's not a mild dip. It's the kind of grade that signals a system under real stress — and for the utilities and contractors responsible for aging transmission infrastructure across North America, the implications are immediate.
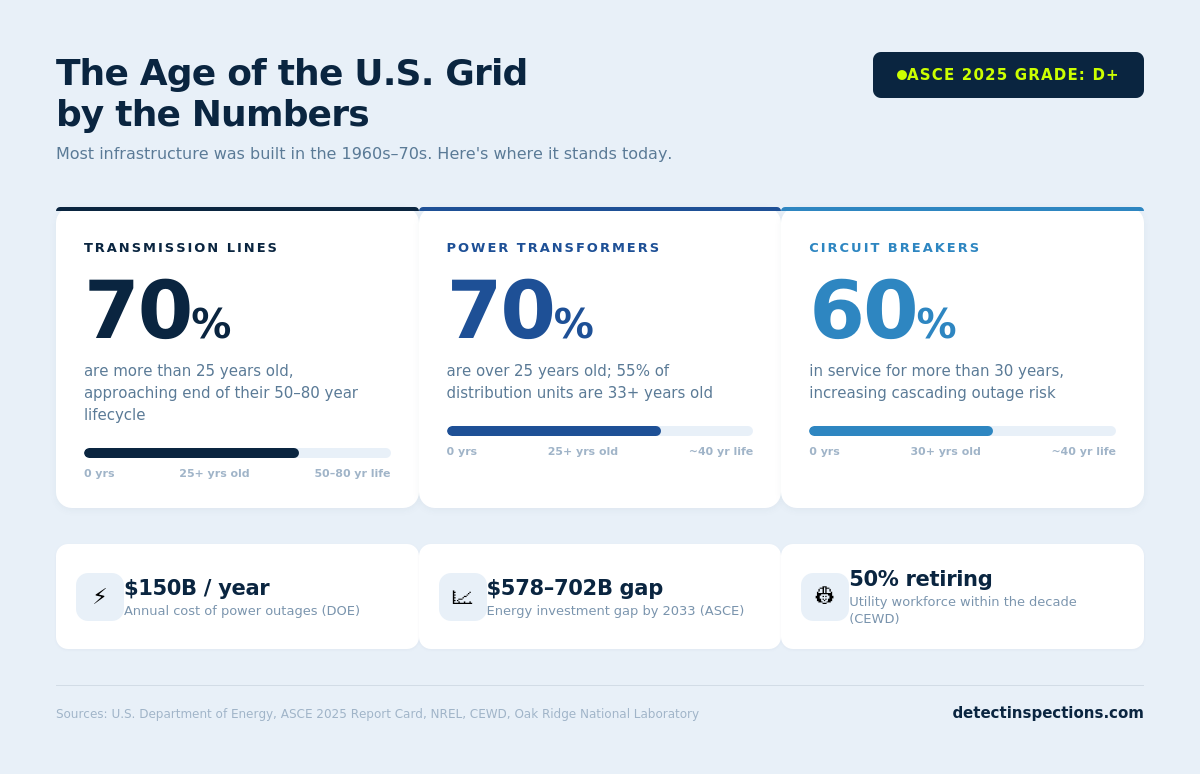
Here's what's behind that grade: according to a U.S. Department of Energy assessment, 70% of transmission lines are more than 25 years old and approaching the end of their typical 50- to 80-year lifecycle. 70% of large power transformers are over 25 years old. And 60% of circuit breakers have been in service for more than 30 years. Most of this infrastructure was built in the 1960s and '70s — designed for a population that used a fraction of the electricity we consume today.
The title of this article refers to transmission "structures" — and that's deliberate. The problem isn't limited to the lines themselves. It extends to every tower, pole, insulator, and hardware connection that holds the grid together. When the underlying structures degrade, the entire system is at risk.
For contractors building and maintaining this infrastructure, the question isn't whether things will fail. It's how fast you can see it coming.
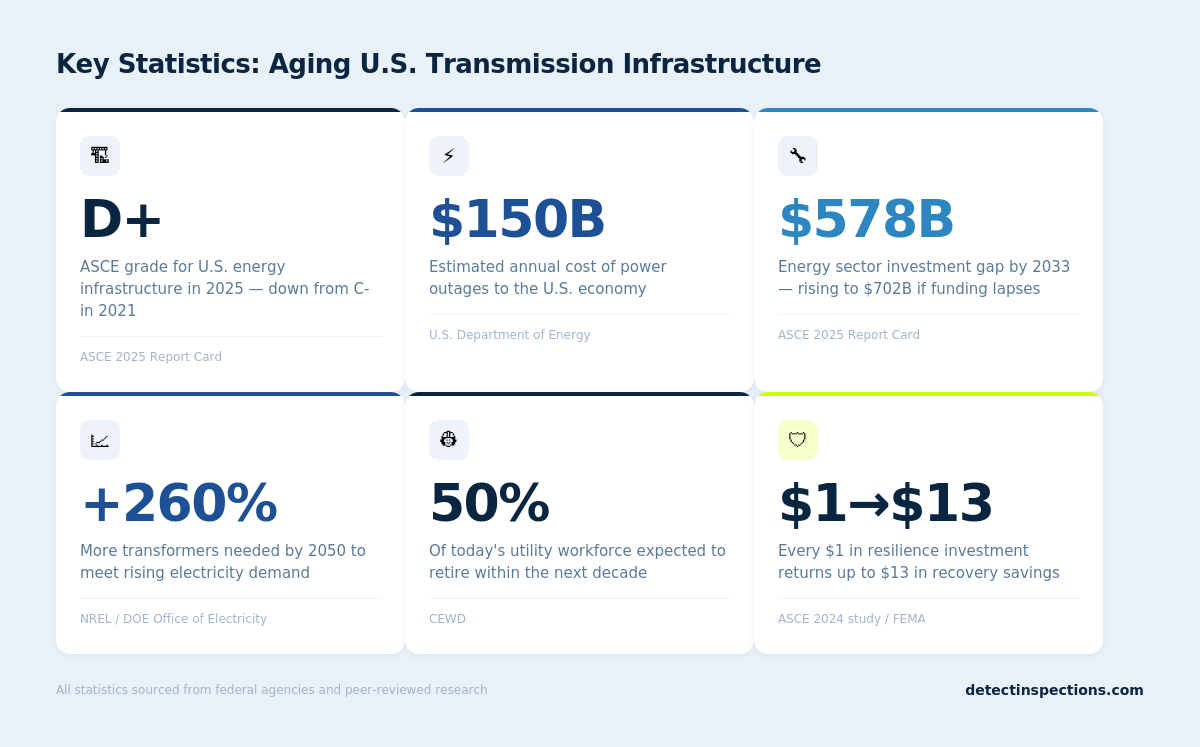
Key statistics at a glance (all sourced below):
- 70% of U.S. transmission lines are 25+ years old — DOE
- 70% of power transformers are 25+ years old — DOE
- ASCE energy infrastructure grade: D+ (2025), down from C- (2021)
- Power outage costs: ~$150 billion/year — DOE; $121 billion in 2024 — ORNL
- Investment gap: $578–$702 billion by 2033 — ASCE
- 50% of utility workforce retiring within the decade — CEWD
- Last updated: March 2026
What "past design life" actually means for aging grid assets
There's a common misconception that "old" means "failing." When it comes to utility asset lifespan, the reality is more nuanced — and in many ways, more dangerous.
According to researchers at the National Renewable Energy Laboratory (NREL), assets designed to last 30 to 40 years are routinely lasting 40, 50, and even over 60 years. On the surface, that sounds like a good thing. The infrastructure works — until it doesn't.
The problem is that failure rates don't increase in a straight line. They accelerate. An asset that's been reliable for decades can shift from functional to critical without much warning, especially when you combine age with increased electrical load and more frequent extreme weather events. NREL projects that the rate of transformer failures will accelerate significantly after 2030, as the majority of the national fleet crosses further beyond expected service life.
Think of it this way: driving a car past 200,000 miles isn't inherently dangerous. But every day behind the wheel is a coin flip that gets a little less favorable.
Today, 55% of U.S. distribution transformers are already 33 years or older — nearing the end of their roughly 40-year expected lifespan. There are between 60 and 80 million of these units in service across the country. The compounding effect of aging assets, extreme weather, and rising demand creates a cascading risk profile that traditional time-based inspection schedules were never designed to manage.
This is where the distinction between "old but functional" and "old and about to fail" becomes critical — and where condition-based asset intelligence changes the equation. Identifying defects before failure is the difference between a planned repair and a catastrophic outage.
Rising electricity demand meets aging transmission infrastructure
The grid isn't just aging. It's being asked to carry loads it was never designed for.
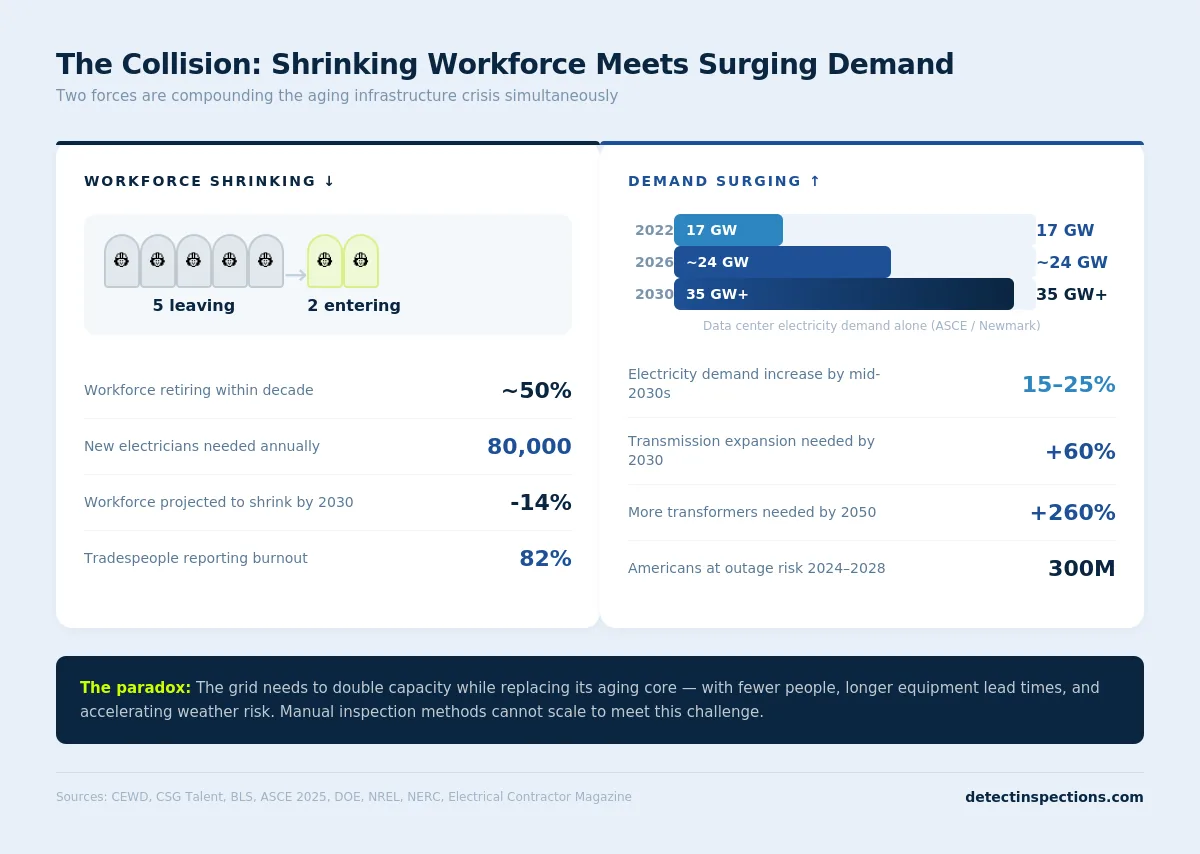
Industry projections estimate U.S. electricity demand will increase by 15–25% by the mid-2030s — what the ASCE calls the highest demand growth in two decades. The DOE estimates that transmission systems alone will need to expand by 60% by 2030 to support new capacity and the transition to renewables.
Data centers are a major driver. They consumed 17 gigawatts (GW) of power in 2022. By 2030, that figure is expected to reach 35 GW. The ASCE notes that a single large data center consumes as much energy as 80,000 homes, and demand for these facilities is climbing roughly 10% per year. Layer electric vehicle charging, heat pump adoption, and industrial electrification on top, and the scale of what the grid must absorb becomes clear.
The North American Electric Reliability Corporation (NERC) has warned that 300 million Americans could face elevated power outage risks between 2024 and 2028 — particularly in Texas, California, the Southwest, New England, and the Midwest.
Here's the paradox contractors live with every day: the grid needs to roughly double its transmission capacity while simultaneously replacing its aging core. That means more work on more fragile assets, often with the same number of people — or fewer.
The true cost of power outages from aging infrastructure
The numbers behind grid failure aren't abstract. They're staggering.
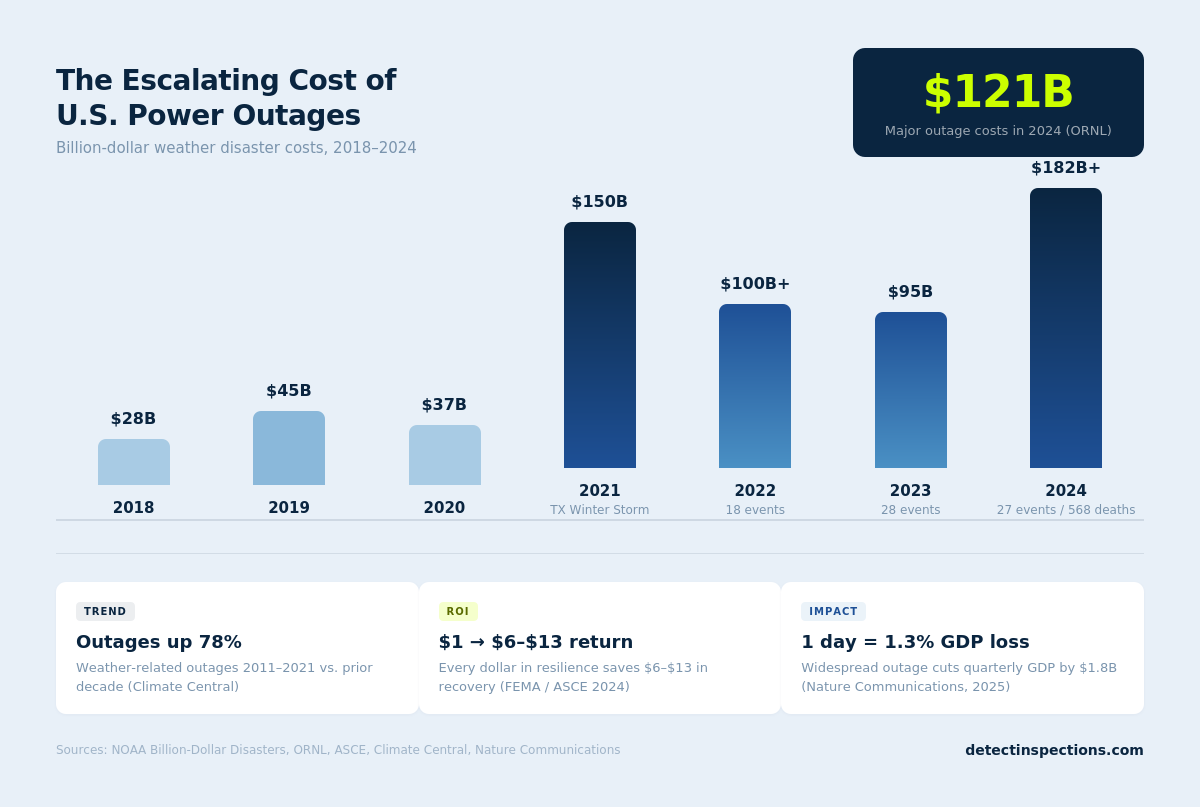
The U.S. Department of Energy estimates that power outages cost the American economy approximately $150 billion every year. An analysis by Oak Ridge National Laboratory found that the total burden of major power outages climbed to $121 billion in 2024 alone, with the highest per-customer costs concentrated in the Southeast.
The damage extends beyond economics. In 2024, the U.S. experienced 27 separate billion-dollar weather disasters, causing 568 deaths and more than $182 billion in total damages. A Climate Central analysis found that weather-related power outages increased roughly 78% between 2011–2021 compared to the prior decade — and that trend is accelerating.
When individual events hit, the costs are acute. The 2021 Texas Winter Storm caused an estimated $130 billion in damages. Hurricane Beryl in 2024 left more than 2 million Texans without power during a heatwave, causing $1.3 billion in infrastructure damage in the Houston area alone.
A 2025 study published in Nature Communications put a finer point on the economic impact: a single 1-day widespread power interruption reduced a utility service area's quarterly GDP by 1.3%, or roughly $1.8 billion — driven overwhelmingly by disruption effects rather than price signals. A 14-day interruption? That figure climbed to a 10.4% GDP reduction.
For contractors, there's a hidden cost buried in every emergency: reactive work pulls crews and equipment away from planned modernization projects, creating a cycle where the grid falls further behind with every unplanned outage. Emergency work is higher-risk, lower-margin, and accelerates burnout across already-stretched teams.
The math behind resilience investment is clear. A 2024 study cited in the ASCE Report Card found that every $1 spent on resilience and preparedness saves communities $13 in post-disaster recovery costs. FEMA's own analysis estimates a return of at least $6 per dollar invested. Early detection isn't just good practice — it's the highest-ROI form of resilience a utility or contractor can invest in.
How the utility workforce shortage compounds aging grid risks
Even if the funding were unlimited, the people aren't there.
The Center for Energy Workforce Development (CEWD) estimates that nearly 50% of today's utility workforce will retire within the next decade. The pipeline to replace them isn't keeping up. According to CSG Talent's 2026 industry analysis, for every five experienced electricians leaving the trade, only two are entering — and 82% of tradespeople report moderate-to-high levels of burnout.
The Bureau of Labor Statistics projects that the industry needs 80,000 new electricians annually through 2031 just to keep pace. Meanwhile, Electrical Contractor Magazine reports that the electrical workforce is projected to shrink by 14% by 2030, even as demand could increase by 25% over the same period.
Traditional visual inspection is labor-intensive, subjective, and inconsistent. It depends on who's looking and what they happen to notice on any given day. Industry practitioners report that reviewing multiple high-resolution images for a single structure takes several minutes — multiply that across thousands of poles per circuit and tens of thousands across a system, and you quickly overwhelm available staff.
The math simply doesn't work. You can't inspect your way out of aging infrastructure with a shrinking workforce using manual methods.
This is why autonomous inspection platforms are becoming essential. By turning any visual data — drone footage, truck-mounted cameras, smartphone photos — into predictive intelligence, smaller crews can cover more assets with better accuracy and faster turnaround. That's not a nice-to-have. It's the only way the numbers add up.
How utility contractors are shifting to condition-based inspection
The organizations pulling ahead aren't just spending more. They're fundamentally rethinking how inspection and maintenance decisions get made.
The most significant shift is from time-based to condition-based inspection. For decades, the industry default has been to inspect on a calendar — every three years, every five years, regardless of actual grid infrastructure condition. That made sense when the grid was younger and the workforce was larger. It doesn't anymore. With assets aging non-linearly and crews stretched thin, the only sustainable approach is to inspect based on actual asset health data — and direct limited crew hours where the risk is highest, not just where the schedule says to go next.
This requires a second shift: from subjective human observation to AI-augmented analysis. Visual AI trained on transmission and distribution defect patterns can process thousands of images and identify issues that are difficult for the human eye alone to catch consistently — corrosion patterns, hardware degradation, structural fatigue, and bolt-level failures that may not be visible from ground level or during a quick flyover.
The value of this approach shows up in the field. In one deployment, DetectOS identified a loose clevis bolt in a suspension assembly on a brand-new HVDC renewable transmission line. The defect — missed during conventional quality assurance — threatened to drop a major conductor before winter conditions hit. Catching it prevented what would have been a $1M+ outage on infrastructure that hadn't even completed its first season of operation. That's not an aging-infrastructure story. It's a reminder that condition-based intelligence matters for new construction too.
The third shift is from reactive prioritization to risk-based severity scoring. When every detection is geo-tagged, linked to the correct structure, and ranked by severity, field teams know exactly where to focus limited resources — not on the easiest structures to reach, but on the highest-impact repairs.
Finally, the contractors winning new work are the ones investing in audit-ready documentation. Utilities increasingly require detailed, annotated inspection records as part of master service agreements. Automated reporting with geo-tagged imagery and validated severity data creates the paper trail that wins and retains contracts.
The ROI case supports all of this. Grid modernization research shows that proactive asset management yields a 20–40% reduction in outage costs. For contractors competing for MSAs in an environment where Centuri enters 2026 with 90%+ of its plan under contract, differentiation through data-driven inspection capability isn't optional — it's how you stay competitive.
Why proactive grid inspection can't wait
The grid is older than it's ever been. It's carrying more load than it was ever designed for. And it's being maintained by a workforce that's shrinking.
None of these trends are reversing. But the contractors and utilities that see the condition of their assets — clearly, quickly, and at scale — before failure cascades are the ones that will define the next era of power grid reliability.
Detect gives utilities and their contractors a new way to see, manage, and protect their assets. From transmission towers to distribution poles to substations, DetectOS turns any visual data into predictive intelligence — with same-day analysis, expert-validated results, and zero false positives. See how it works.
Schedule a free asset analysis and see what your current inspections are missing.
Related reading: understand the ROI of AI asset inspection for utilities and how AI inspection helps prevent grid outages.
