
AI Utility Inspection for Storm Damage Response and Outage Recovery
After a major storm, the scarcest resource is not crews or trucks - it is a trustworthy picture of what broke, where, and how badly. Here is how AI-powered utility asset inspection turns storm imagery into recovery decisions and claim-ready evidence, and what to put in place before the season starts.
Utility storm damage assessment works best when imagery is processed as it lands, not after the campaign. AI maps each photo to a structure, grades it for usability, and screens it for damage; expert reviewers confirm what matters. Restoration leaders then work from a severity-ranked damage register instead of thousands of unread photos.
- Weather is the outage story. About 80% of major U.S. outage events trace to weather, and the average customer went roughly 11 hours without power in 2024 (U.S. Energy Information Administration, December 2025).
- Storm capture is ad-hoc capture at its extreme. Around 30% of ad-hoc inspection imagery is rejected as unusable - and a storm removes the shot list, the references, and the daylight all at once (Detect, State of Utility Drone Inspections, 2026).
- The Storm Evidence Cycle has four phases: Baseline, Sweep, Triage, Register. The register the storm produces becomes the baseline the next one is measured against.
- Speed is a pipeline property, not a promise. On a 618-structure remote audit, triage ran nightly during capture and a structured defect register shipped within 72 hours of the last flight.
- Recovery evidence outlives restoration. The same register that routes crews feeds FEMA documentation, insurance claims, and construction warranty deadlines.
- Why storms dominate outage risk
- How storm damage assessment works today
- Why storm damage data fails the teams who need it
- How AI-powered inspection changes storm response
- The Storm Evidence Cycle
- What FEMA, insurers, and warranties require
- How drone service providers prepare for storm work
- Preparing before the season
- The bottom line · FAQ
The storm passes, and for a few hours the control room knows less about the system than at any other moment in the year. Breakers are open and customer calls are stacking into outage clusters. The damage itself - broken poles, failed crossarms, conductor on the ground - is scattered across hundreds of square miles no crew has seen yet. Every restoration decision made in that window runs on whatever picture of the damage exists.
This guide is about making that picture arrive faster, and making it good enough to act on twice. Once to restore service. Again, weeks later, to support the FEMA filing, the insurance claim, and the warranty case. The two uses share one input and carry very different standards. Meeting both is a data problem, and it is mostly decided before the storm forms.
Why do storms dominate outage risk on the grid?
Because weather is the one failure driver that hits thousands of structures in the same week. About 80% of major U.S. outage events trace to weather, and the average customer was without power for roughly 11 hours in 2024 (U.S. Energy Information Administration, December 2025). The economic weight matches: weather-driven outages have cost the U.S. economy an average of about $67 billion a year over the past decade, and roughly $121 billion in 2024 alone (Oak Ridge National Laboratory, March 2026).
Aging hardware raises the stakes. Roughly 70% of U.S. transmission lines are 25 years old or older (U.S. Department of Energy, Quadrennial Technology Review, 2015), and a structure carrying a marginal defect into storm season is the one most likely not to come out of it. That is why the strongest storm strategy starts long before landfall: finding and fixing the weak points is the territory of AI inspection software that helps prevent grid outages. This guide picks up where prevention ends - the storm arrives anyway, and recovery becomes the job.
How does utility storm damage assessment work today?
Most utilities run storm damage assessment as a staged sweep: ground patrols and windshield surveys close to population, helicopter flybys along transmission corridors, and - increasingly - drones wherever structure-level detail is needed. Each method answers a different question, and the mix is the real design decision.
| Method | What it answers fast | Structure-level precision | Reach after a storm | Evidence value |
|---|---|---|---|---|
| Ground and windshield patrol | Which streets and taps are down | Low from the road; poles are assessed from one side, at distance | Blocked by flooding, debris, washed-out access | Notes and phone photos, rarely tied to structure IDs |
| Helicopter flyby | Which corridor segments took damage | Gross conditions only - a leaning tower, a downed span; hardware-level defects are invisible from 300 feet | Excellent range; limited by weather windows and cost per hour | Crew observations; imagery seldom per-structure |
| Drone capture with AI review | What exactly failed on each structure in the damaged segments | Hardware-level: insulators, connections, crossarms, foundations, at safe standoff | Flies from any clear patch; unaffected by road access | Georeferenced, time-stamped, per-structure imagery - the claim-grade tier |
The sequencing matters more than the tools. A helicopter finds the damaged ten miles; drones document every structure in them; ground crews arrive with a work list instead of a search area. What breaks this model in practice is almost never the flying. It is what happens to the imagery afterward.
Why does storm damage data fail the teams who need it?
Because storm capture is ad-hoc capture at its extreme, and ad-hoc capture already fails at a measured rate. In Detect's industry research, about 30% of ad-hoc inspection imagery - no shot sheet, mixed settings, graded after the fact - is rejected as unusable (Detect, State of Utility Drone Inspections, 2026). The same research breaks delivered-imagery rework into causes: GPS misassociation 35%, missing component coverage 30%, resolution and focus 18%, metadata mismatch 12%, lighting and weather artifacts 5%.
Now run those causes through a storm. Structures are leaning or gone, so the GPS association problem gets worse. Pilots fly under pressure without a shot list, so coverage gaps multiply. Light is bad and rain is on the lens, so sharpness drops - and sharpness decides what analysis can see at all. In Detect's grading data, sharp imagery leaves 100% of a 258-type defect catalog assessable, soft imagery 69%, and blurry imagery 7%. The grading discipline behind those numbers exists for one reason: every image is scored for usability before any defect model runs, so a bad frame is flagged in hours rather than discovered in a claims meeting.
~30% of ad-hoc inspection imagery is rejected as unusable - and storm response is the most ad-hoc capture a utility ever buys. The fix is not better cameras. It is a written capture standard, applied by every pilot, graded as the data lands.
Source: Detect, State of Utility Drone Inspections, 2026.
The quiet consequence: a third of the flying a utility pays for in the worst week of its year can produce imagery that neither routes a crew nor survives an adjuster. That is the failure AI-assisted triage is built to prevent - not by making photos better, but by finding the unusable ones while the aircraft is still in the area.
How does AI-powered inspection change storm damage response?
It moves the quality check and the damage screen to the same night the imagery lands. In a workflow like DetectOS, four things happen in sequence: each image is mapped to a structure, graded for usability, screened against a defect catalog, and queued for expert review by severity. People stay in the loop on purpose. After a storm, debris and standing water produce exactly the scenes that fool a model. So AI screens the volume, and trained reviewers confirm every finding that would move a crew.
Two field campaigns show what that machinery does under deadline pressure. On a newly commissioned HVDC intertie, a 30-day campaign put about 122,000 images through that pipeline with a team of three. 1,270 frames were flagged. The one defect that mattered - a clevis bolt backed off, cotter key missing, found in the line's first operating season - was cleared in 120 minutes of field time. More than $1M in forced-outage revenue was averted (Detect Data Quality Program asset-owner report). And on a remote 618-structure warranty audit, triage ran nightly while capture continued; the full severity-ranked register shipped within 72 hours of the last flight.
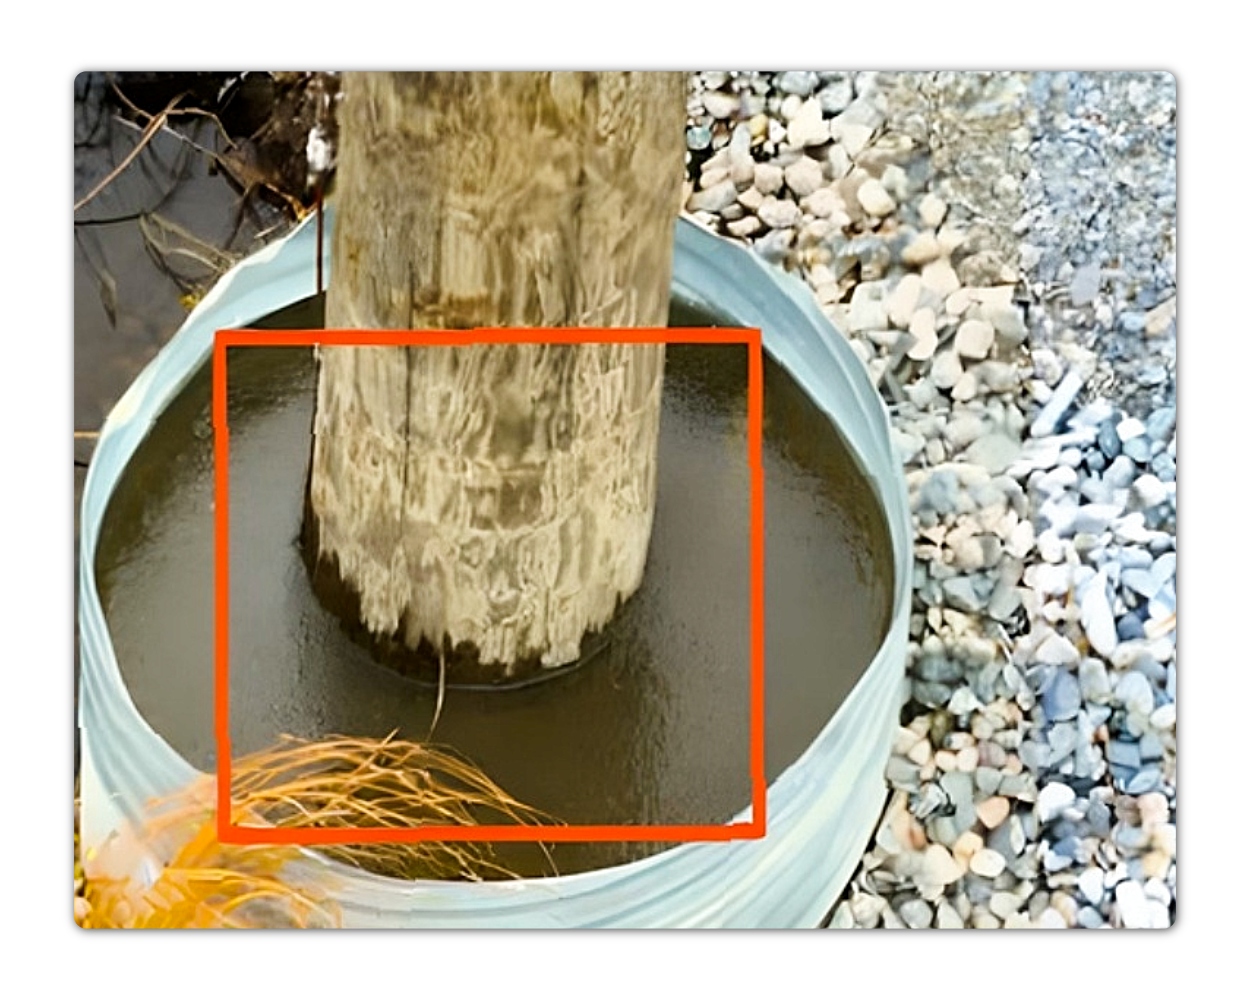
Flooded footings are a storm's slowest-moving damage: invisible from the road, consequential for months. Per-structure aerial imagery is often the only safe way to document them.
The practical change for a restoration organization is the shape of the output. Instead of folders of imagery to be read later, the overnight product is a short list: structures confirmed damaged, ranked by severity, each with its evidence attached. Crews are routed by that list. And because every image in it is tied to a structure and a timestamp, the same list starts the paperwork - which is where storm data earns its second life.
What is the Storm Evidence Cycle?
The Storm Evidence Cycle is Detect's framework for storm data readiness: four phases that turn one storm's chaos into the next storm's starting point. Baseline, Sweep, Triage, Register - then the register becomes the new baseline, and the cycle closes.
What belongs in the baseline?
The last inspection cycle, captured to a standard and filed per structure - because damage is a comparison, not an observation. A leaning tower means one thing if it was plumb in May and another if it has leaned for years. Utilities that inspect on a defensible cadence already own this phase; the work is making the record reachable by the restoration organization, not just the asset management team.
What does the sweep capture?
Every structure in the damaged segments, flown to a written storm standard: the angles that reveal the damage states that matter, a settings floor that protects sharpness in bad light, and an association method that does not depend on references the storm may have removed. The sweep is where the pilot roster earns its contract - many aircraft, one standard.
How does triage rank the damage?
Nightly, while the sweep continues. Grading flags unusable frames in time to re-shoot them; association ties each image to its structure; the defect screen sorts the volume; expert reviewers confirm severity on everything that would dispatch a crew. Triage is the phase that converts imagery into a decision product - and the phase most storm programs improvise.
What goes into the register?
One record per structure: condition, severity, evidence, and disposition - repaired, monitored, deferred, claimed. The register routes crews during restoration, then becomes the storm's institutional memory: the FEMA exhibit, the insurer's documentation, the warranty notice, and the baseline for the next event. If the storm's data ends up in folders instead of a register, the next storm starts from zero.
What evidence do FEMA, insurers, and warranty claims require after a storm?
Documentation that ties each damaged structure to a location, a time, and - wherever possible - a prior condition. The compliance landscape has been moving toward photographic proof for years, and 2026 sharpened it: what FEMA and insurers now expect utilities to prove before the storm is itself a documented standard, and a post-storm filing is strongest when it references the pre-storm record.
The warranty case is the most time-boxed of the three. On the remote audit cited above, the utility documented 618 lattice structures across two new transmission lines in nine field days - muskeg and boreal terrain, no road access - because construction warranties were expiring and helicopter photos from 300 feet could not support a claim. The structured register, delivered within 72 hours of the last flight, let claims go to the builder before winter made repairs ten times more expensive. Service to 17 remote communities stayed protected.
The common thread across all three audiences is that a photograph is not yet evidence. What qualifies it is the workflow around it - association, grading, review, and a record that holds together under hostile questions. That chain, from pixels to claim-ready evidence a photo analysis workflow produces, is the same one that ran during restoration. No second data collection, no reconstruction from memory.
How should drone service providers prepare for storm response work?
Storm rosters are the fastest-growing door into utility work for drone service providers - and the easiest place to destroy a reputation. A DSP that delivers crisp, associated, first-pass-accepted imagery in the worst week of the year becomes very hard to unseat. One that delivers 30% rejects becomes a story the utility tells other utilities.
The preparation is unglamorous. Fly the utility's capture standard before the season, not during the event. Prove association on structures you have never seen - storm work is always unfamiliar territory. Protect the settings floor when the light turns, because rework economics are unforgiving: across utility contracts, 15-25% of delivered imagery typically needs remediation, and standardized-capture programs cut that to 3-7% within two campaigns (Detect, State of Utility Drone Inspections, 2026). On storm work there is no second campaign - the re-fly window closes when the adjuster's report is due. Utilities, for their part, are solving the multi-vendor problem by contracting a qualified pilot network flying one capture standard instead of negotiating standards vendor by vendor in the dark.
How do you prepare inspection data for storm season?
Before the season, as a program - not during the event, as improvisation. Five moves cover it.
- Make the baseline findable. Treat the latest inspection cycle as the pre-storm reference: every structure photographed to a standard, graded for usability, and filed where the restoration organization can reach it - not in a contractor's archive.
- Write the storm capture standard. Shot-sheet angles for the damage states that matter, a usability floor for settings and sharpness, and an image-to-structure association method that still works when landmarks and GPS references are down.
- Contract the pilot roster before the season. Qualified pilots on the one written standard, with coverage areas, activation terms, and data delivery named in the contract - signed in spring, not negotiated in the dark.
- Run the data path as a drill. Fly one feeder through the full path: ingest, grading, association, expert review, register. The bottleneck you find in the drill is the one the storm would have found for you.
- Rehearse the claims package. Decide who files, which evidence fields FEMA, insurers, and warranty contracts expect, and which deadlines apply - so the register feeds the paperwork the week it exists.
None of these five require new technology in the storm itself. They require the storm to land on a program that already knows its structures, its standard, its pilots, and its paperwork. That is the quiet advantage: the utilities that recover fastest are the ones for which the storm sweep is just another campaign - bigger, faster, and angrier, but running on rails that already exist.
The bottom line: outage recovery is a data problem wearing a logistics costume
Crews restore power. But everything that decides where crews go - and everything that happens in the claims and compliance months afterward - runs on the quality of the damage record. Utility storm damage assessment built on AI-assisted triage, expert review, and a per-structure register gives a utility both: restoration routed by evidence, and evidence that outlives restoration.
The storm season test is simple. If the next major event hit your territory this week, would your team be reading photographs - or working a register?
Find out what your storm imagery would be worth
Send Detect a recent inspection set - storm sweep or routine cycle. The free audit grades usability and association image by image: the first honest measure of whether your capture would survive restoration triage and an adjuster's questions.
Book a free audit →