
Best AI Inspection Platforms for Utility Capital Planning (2026)
U.S. utility capital spend is on pace to roughly double through 2030. Which structures that money reaches is decided by evidence - and most platforms that touch inspection imagery cannot produce evidence a capital plan can act on. This comparison shows how to tell the ones that can apart.
- The stakes moved first: U.S. utility CapEx is on pace to roughly double, from $0.7T in 2015-2024 to $1.4T in 2025-2030 (Morningstar DBRS, cited in the Detect State of Utility Drone Inspections 2026). Roughly 70% of transmission lines are already 25 or more years old (DOE).
- Capital risk concentrates. On one newly built 345kV line, 51 of 67 critical findings - 76% - sat in a single construction segment. Evidence finds the cluster; assumptions spread the budget evenly across it.
- Platform categories differ on three things that matter to a capital plan: whether they can assess the whole fleet, whether they rank what to fix first, and whether their output lands in the systems where capital is planned. That is the Capital Planning Fit Test.
- Evidence timing is itself capital. One commissioning QA program put 13,004 Critical and High-Priority defects on the contractor's budget instead of the utility's, because the findings landed inside the warranty window.
- No single category does everything. EAM is the system of record, GIS is the map, and inspection intelligence is the evidence engine that feeds both.
Every capital plan answers two questions: what gets money this cycle, and why. The second question has gotten harder. Regulators, boards, and rating agencies now ask utilities to show the condition evidence behind replacement and hardening programs, not just the age bands. This guide compares the platform categories that turn inspection imagery into that evidence - and gives you a three-question test for judging any of them.
Why does utility capital planning need inspection data?
Because a capital plan is a bet on where failures will happen, and inspection data is the only current record of where they are forming. Per Morningstar DBRS, U.S. utility CapEx is on pace to roughly double - from $0.7 trillion across 2015-2024 to $1.4 trillion across 2025-2030 (cited in Detect's State of Utility Drone Inspections 2026). That money is being planned against asset records that are, at many utilities, older than the engineers reading them. Roughly 70% of U.S. transmission lines are 25 or more years old (DOE), and weather-driven outages cost an estimated $121 billion in 2024 alone (ORNL, March 2026).
Age bands and design specs tell you which assets are old. They do not tell you which old assets are failing. That difference is the whole capital question, because condition risk clusters instead of spreading evenly - and only evidence shows you the cluster. Where hardening money specifically should go first is its own discipline; our grid resilience guide covers where hardening investment goes first. This page stays on the platform decision: which software can produce the evidence at all.
One more pressure makes the platform choice current. Regulators have started trimming capital programs that cannot separate genuine risk reduction from catch-up maintenance. The utilities that survive that scrutiny are the ones that can show, structure by structure, what condition the asset is in and what it costs to leave it alone. "Our lines are aging" funds a study. A severity-ranked defect register funds a program.
Which platforms do utilities compare for capital planning?
Five categories touch inspection imagery on the way to a capital decision. They are complements more often than competitors - the mistake is expecting any one of them to do another's job. For the general buyer's comparison, start with the four categories of AI inspection software; the view below re-scores those categories against capital planning specifically.
| Platform category | Examples | What it does well | The capital planning gap |
|---|---|---|---|
| EAM / APM suites | IBM Maximo, SAP, Oracle WAM, IFS | System of record; work and capital program management; budget workflows | Condition enters as manually keyed codes - the suite manages evidence, it does not create it |
| GIS platforms | Esri ArcGIS | Spatial context; feeder- and territory-level risk layers | Needs per-structure condition attributes from somewhere else to mean anything |
| Generic AI visual inspection tools | Manufacturing and machine-vision platforms | Defect detection models; fast labeling pipelines | No utility defect taxonomy, no severity governance, no path into utility planning systems |
| Drone data management platforms | Capture, storage, and photogrammetry tools | Flight logistics, image storage, orthomosaics | Photos are not findings - nothing is graded, ranked, or work-order ready |
| Utility inspection intelligence platforms | DetectOS | Scored capture, utility defect catalog, expert-validated severity, GIS- and EAM-ready condition records | Not the system of record - it feeds EAM and GIS rather than replacing them |
The pattern to notice: the first four categories each hold one piece of the capital story. The asset register lives in EAM, the geography in GIS, the detection capability in vision tools, the raw imagery in capture platforms. What capital planning actually consumes - a risk-ranked, per-structure condition record it can price - has to be assembled deliberately. That assembly is what the fifth category exists to do, and what asset inspection software has to carry end to end: identity, location, evidence, and severity on every finding.
What is the Capital Planning Fit Test?
The Capital Planning Fit Test is a three-question screen Detect applies when a utility asks which inspection platform will actually move its capital plan. Feature lists hide the differences; these three questions expose them. Can the platform see the whole fleet? Can it rank what it sees? And can your planning systems use what it produces? A platform that fails any one of the three can still be useful - it just cannot carry the capital case on its own.
What predictive intelligence platforms handle large U.S. drone inspection datasets?
The ones that pair AI screening with a known assessment ceiling - because at capital planning scale, the dataset problem is not storage, it is judgment. A single transmission campaign can produce tens of thousands of images. On one newly built ~250-mile HVDC intertie, a 30-day campaign put about 122,000 images through AI screening with a three-person team; the AI flagged 1,270 for expert review (Detect Data Quality Program, 2026). No manual review process reaches that volume inside a planning cycle, and no unreviewed model output deserves a budget.
Scale has a second, quieter requirement: knowing what the imagery can support. On a sharp capture, 100% of Detect's 258-type, 19-class defect catalog is assessable. On a soft capture, 69%. On a blurry one, 7% (Detect Data Quality Program, 2026). A platform that does not grade capture quality at ingest will happily analyze a dataset that can only ever surface a fraction of the defects - and the capital plan built on it inherits the blind spot. The mechanism behind that ceiling is covered in why AI inspections miss defects.
Does it rank what capital should fix first?
Detection without severity governance produces a longer list, not a better plan. The capital question is always which fraction of findings justifies money this cycle - and the field data says that fraction is small and clustered. On one newly built 345kV line, expert review confirmed 67 critical findings out of 45,335 total findings across 927 structures. 51 of those 67 - 76% - sat in a single construction segment (Detect / CompassData 345kV case study, 2026). A platform that ranks findings by validated severity hands you that cluster. One that exports raw detections hands you 45,335 rows.
Ranking is also what converts findings into fundable programs. On two aging wooden H-frame lines, a 3-person crew covered all 96 structures in one field day; expert-reviewed analysis flagged 55 high-risk conditions - 35 on one line, 20 on the other. After a decade of partially funded or denied capital requests, the evidence-ranked report moved the asset owner to fund a complete rebuild of both lines (Detect wooden H-frame case study). How those ranked findings become an approvable document is the subject of our guide to risk-based utility work plans.
Does the output land where capital is planned?
Capital decisions are made in EAM, GIS, and the budget model - not in an inspection vendor's dashboard. The connection question is whether the platform's output arrives in those systems as usable records: findings keyed to your asset IDs, severity in your codes, photo evidence attached, exportable in your columns. If condition data has to be re-keyed by hand to reach IBM Maximo or Esri ArcGIS, the re-keying step becomes the real bottleneck of the capital cycle. The data-layer contract that makes this work - identity, location, taxonomy, evidence on every record - is covered in how to integrate AI utility inspections with EAM, GIS, and OMS.
How do utilities justify investment in AI asset inspection software?
With avoided cost, captured warranty value, and unlocked programs - three arguments that only exist when the evidence is specific. The pattern across Detect's field programs is consistent: the investment case is never "we inspected more." It is "here is the loss that did not happen, priced."
Avoided cost. On the 345kV line above, one missing cotter key found inside the warranty window cost about $15,000 in planned live-line repair. Left to age three more years toward failure, the same defect carried roughly $150,000 of statistical risk (Detect / CompassData 345kV case study, 2026). On the HVDC intertie, a single clevis bolt finding, cleared in 120 minutes of field work, averted a forced outage the operator valued at more than $1M (Detect Data Quality Program, 2026). The line had been commissioned in spring; engineering judged the defect would have failed under winter load.
On one 345kV commissioning QA program, 13,004 Critical and High-Priority defects were fixed at the EPC's cost. Every finding was documented and severity-ranked inside the warranty window, so remediation landed on the contractor's budget instead of the utility's first capital cycle. Evidence timing is itself capital.
Source: Detect / CompassData 345kV case study, 2026.
Unlocked programs. The H-frame rebuild had been requested for a decade and never fully funded. What changed was not the risk - it was the evidence: 55 high-risk conditions, photographed and severity-ranked, across 96 structures. Boards fund what they can see. The full economics - rework avoided, truck rolls saved, the cost of unusable data - are worked through in the AI inspection ROI formula; the evaluation mechanics live in the platform evaluation scorecard.
What does capital-grade inspection evidence look like?
Like a record, not a photo album. One structure, its findings, each finding's severity and review status, the image proof behind it, and the export path into your systems - current enough to plan against. When that record exists for every structure on a circuit, the capital conversation changes from adjectives to counts.
Two details in that funnel carry the capital lesson. First, the ratio: 45,335 findings produced 13,004 that deserved money now, and expert review is what made the cut defensible. Second, the timing: because every record was complete - located, photographed, severity-ranked - inside the warranty window, the remediation bill went to the contractor. The same records then became the line's condition baseline, the reference every future inspection cycle is measured against.
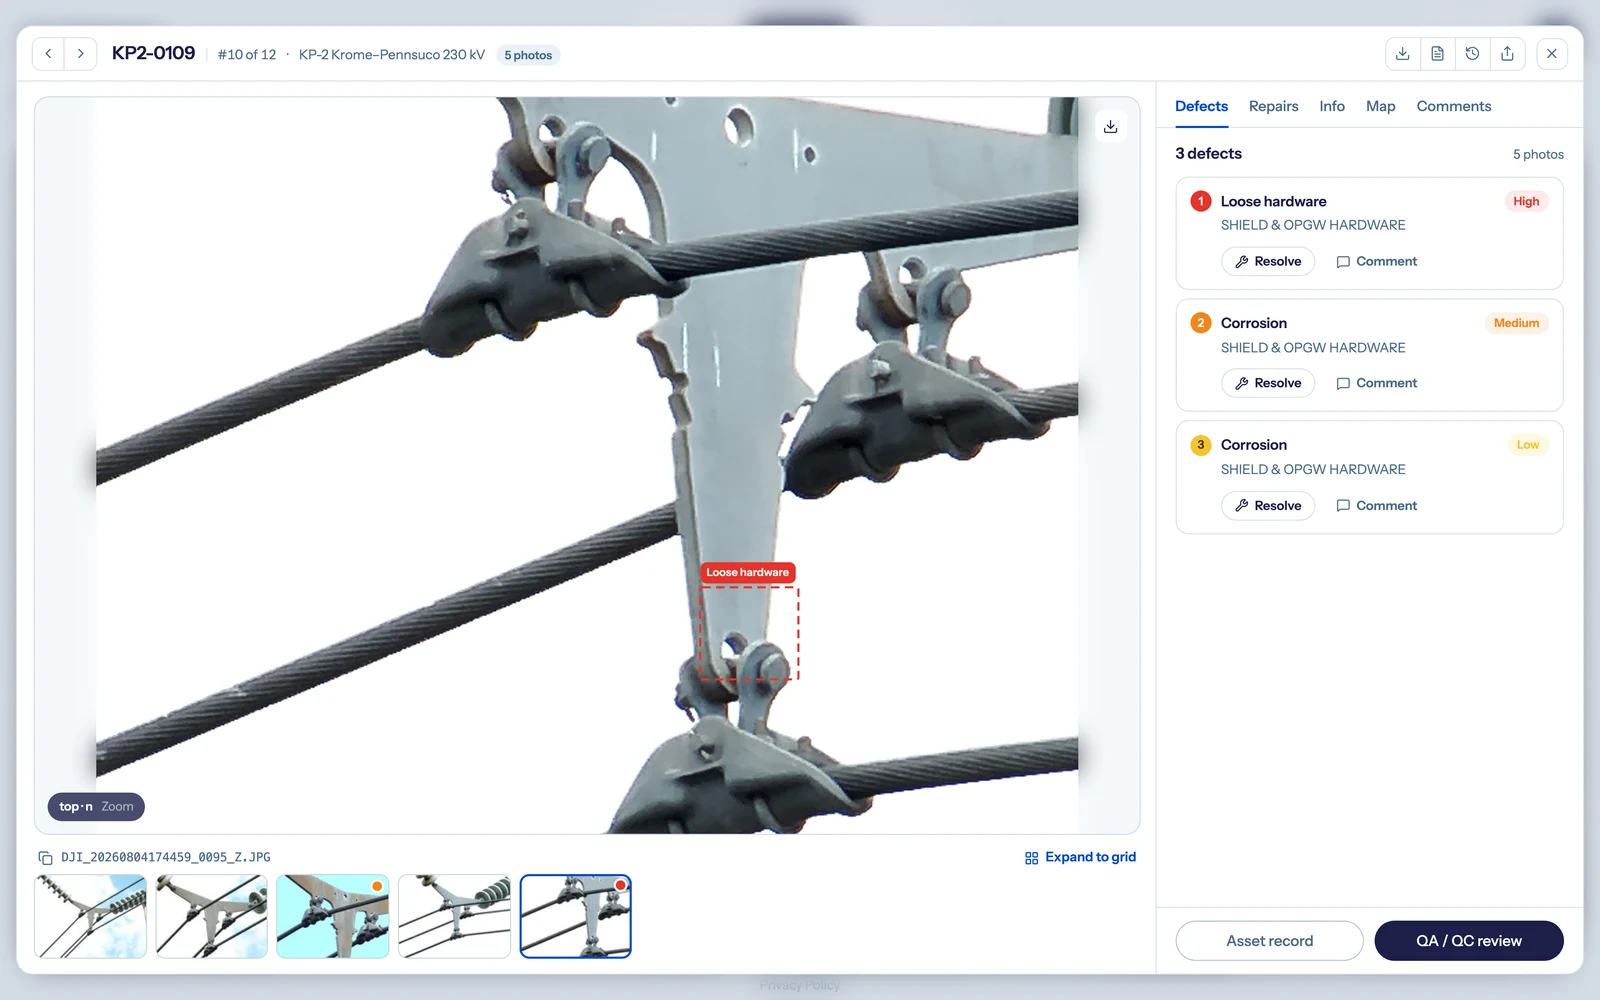
The unit of capital-grade evidence: one structure, its findings, severity, review status, and photo proof in a single record. Shown in a DetectOS demo environment.
How do you choose AI visual inspection platforms for utility capital planning?
Run a paid-nothing pilot against the Fit Test before any procurement motion. Five steps, in the order that protects you:
- Name the capital decision first. Pick one real decision this platform must inform - a replacement program, a hardening filing, a warranty claim - and evaluate everything against it.
- Test on your own imagery. Send a recent campaign's images, including the imperfect ones. A platform that does not grade capture quality at ingest fails question 1 on the spot.
- Audit the severity governance. Ask who confirms a critical finding, and what their utility credentials are. Unreviewed detections cannot carry a budget.
- Trace one finding to your systems. Follow a single defect from image to GIS layer to EAM work order. Count the manual steps - each one is a recurring cost.
- Price the evidence, not the flight. Compare platforms on cost per usable, decision-ready finding - not per image or per structure.
If a vendor resists step 2, that is the answer. The strongest platforms in this category win on exactly that test, because scored capture and expert review are where the differences stop being marketing.
The bottom line
Capital planning does not need another dashboard. It needs AI visual inspection platforms whose output survives the three questions that decide fit. Coverage of the whole fleet, with a known assessment ceiling. Expert-validated ranking that concentrates spend where risk concentrates. Records that land in GIS and EAM without re-keying. EAM suites, GIS platforms, vision tools, and capture systems each hold a piece; utility-native inspection intelligence is the category built to assemble them into evidence a budget can act on.
That is the standard Detect builds for: decision-grade grid intelligence from every image, across your entire network - so the next capital cycle is allocated on condition, not assumption.
Put your imagery through the Fit Test
Send us imagery from a recent inspection campaign. DetectOS will grade its capture quality, run AI analysis with expert review, and show you the severity-ranked condition evidence your next capital cycle needs.
Book a free audit →