
AI Risk-Based Utility Work Plans: The Executive Guide
Inspection imagery becomes valuable the day it changes what your crews do next quarter. This is how AI inspection platforms turn visual data into a risk-ranked, costed, decision-grade work plan - and what that kind of plan once did in ten minutes.
An AI risk-based work plan converts inspection imagery into a ranked list of maintenance actions, ordered by probability and consequence of failure. It is the output layer of AI predictive maintenance for power grid assets: validated findings in, an evidence-backed plan your leadership can approve without taking anyone's word for anything.
- The work plan is the product. Findings are inputs. A ranked, costed, evidence-attached plan is what changes budgets and outage curves.
- Risk clusters. In one 345 kV campaign, 51 of 67 critical findings sat in a single line segment - concentration a planner can act on.
- Decision-grade beats data-rich. Four tests: evidence-attached, risk-ranked, costed against consequence, auditable.
- Evidence moves money. One field day, 96 structures, 55 validated high-risk conditions - and a decade-stalled rebuild was approved in under 10 minutes.
- Outage prevention is an ordering problem. The defects most likely to cause the next outage get fixed first, while they are still hardware repairs.
- The plan must land in your EAM and GIS. A work plan that lives in a slide deck changes nothing in the field.
Every utility inspection program eventually produces the same uncomfortable meeting. The findings are real, the backlog is long, and the executive across the table asks the only question that matters: which of these do we fund first, and how do you know?
AI inspection platforms are usually sold on detection. Detection is not the scarce resource. Power grid asset inspection already produces more findings than any team can fund at once. The scarce resource is a defensible ordering - a work plan that says these structures, in this sequence, for these reasons, at this cost.
This guide covers that decision layer: what a risk-based work plan is, how AI builds one from visual data, what makes it strong enough to move a budget committee, and how to judge the software that produces it.
What is a risk-based work plan for utility maintenance?
A risk-based work plan is a maintenance program ordered by probability and consequence of failure rather than by inspection route, asset age, or calendar. Each line item carries its evidence: the finding, its severity, its location, and the cost of acting now beside the cost of the failure it prevents.
The contrast is with scheduled maintenance, which treats every structure as equally suspect and spends crew time accordingly. A risk-based plan spends crews where the grid is telling you it hurts. The schedule survives as a regulatory floor; the plan decides where the money goes. Inside the utility asset management stack, it sits between the inspection layer that produces findings and the EAM that schedules the work.
How does AI turn utility visual data into a risk-based work plan?
In five moves: validate the findings, score risk per structure, cluster the work, cost it against consequence, and land it in the systems that schedule crews. Images go in; a plan a leadership team can interrogate comes out.
1. Start from validated findings, not raw detections. AI screens the image volume; named experts confirm defect, severity, and location. Everything downstream inherits the quality of this step - how imagery becomes a failure forecast is its own discipline, and utility visual data analysis only earns its keep once a person has signed the finding.
2. Score risk per structure. Severity comes from the defect. Consequence comes from context: what the structure carries, what fails downstream of it, what it would take to reach it in a storm.
3. Cluster findings into work packages. Crews travel; findings that share a segment share a truck roll. Clustering is also where patterns surface - more on what one 345 kV campaign found below.
4. Cost each package against its consequence. Not "this repair costs $15,000" but "this $15,000 repair removes a seven-figure exposure."
5. Land it in the EAM and GIS. The plan becomes verified, risk-ranked work orders in the systems planners already run - or it never becomes work at all.
What makes a work plan executive-ready?
It passes four tests: every line item carries its evidence, the order reflects risk rather than routing, every cost sits beside the consequence it removes, and the whole trail is auditable. Detect calls this standard the Decision-Grade Work Plan.
Evidence-attached. An executive approving spend on a structure should be able to see the structure - the annotated image, the location, the named reviewer. Binoculars don't leave evidence; a validated finding does.
Risk-ranked. The order of the plan is the argument. If item 40 is scarier than item 4, the ranking - and the committee's trust - collapses.
Costed against consequence. A repair estimate on its own invites deferral. The same estimate beside the outage it prevents invites a signature.
Auditable. Regulators, insurers, and rate-case reviewers ask the same question executives do: how do you know? The plan should answer it line by line.
The clearest demonstration in Detect's field work is a wooden H-frame program. For over a decade, a regional utility manager documented deteriorating lines, submitted capital funding requests, and watched them come back denied. Then one standardized field day covered all 96 structures on both lines with a 3-person drone crew. The analysis validated 55 high-risk conditions - 35 on one line, 20 on the other - rotten poles, loose bolts, splitting cross-arms, every one photographed, located, and severity-ranked. The audit that funded a rebuild did the presenting: the committee approved multi-million-dollar funding in under 10 minutes.
10 minutes. A decade of denied funding requests, then one field day, 96 structures, and 55 validated high-risk findings - and the committee approved the multi-million-dollar rebuild in under 10 minutes. The evidence did the presenting.
Source: Detect wooden H-frame case study, 2026.
How do AI asset inspection platforms reduce unexpected outages on power grids?
By changing the order of work: the defects most likely to cause the next outage get fixed first, while they are still hardware repairs instead of emergencies. Detection finds problems. Prioritization is what prevents outages.
Risk clusters, and clusters can be planned against. In a construction-quality campaign on a new 345 kV line - 927 structures, 45,335 findings - 67 findings were critical, and 51 of the 67 sat in a single line segment. That concentration told the operator where the next failures would come from, and turned 67 critical defects on a new 345 kV line into a targeted remediation plan inside the warranty window, at the contractor's cost rather than the operator's.
A different program shows what a single well-ordered repair is worth. On a roughly 250-mile HVDC intertie - about 2,600 lattice towers, newly commissioned - an AI-screened campaign flagged 1,270 findings, and expert review isolated one that mattered most: a clevis bolt with its cotter key missing, high in a suspension assembly. It was caught in the line's first operating season and cleared in 120 minutes of field time. Engineering assessed the alternative as a dropped conductor and a forced outage - $1M+ in lost transmission revenue averted (Detect Data Quality Program, 2026).
That is what AI outage prevention actually looks like: not a model predicting doom, but a ranked queue quietly moving the right defect to the top. Worked cycle over cycle, the effect shows up as fewer equipment-caused interruptions on covered lines - the mechanism behind preventing grid outages with AI inspection. The backdrop makes the stakes plain: power interruptions cost U.S. electricity customers an estimated $67 billion a year on average, and $121 billion in 2024 alone (Oak Ridge National Laboratory, 2026).
How does AI predictive maintenance for power grid assets change the budget conversation?
It changes the denominator. Instead of pricing inspection per structure, you price validated findings against the failures they prevent - and the comparison stops being close.
The U.S. Department of Energy's operations-and-maintenance guidance puts a functioning predictive program's savings at 8-12% over preventive maintenance and 30-40% over reactive maintenance (FEMP O&M Best Practices Guide). For the un-instrumented majority of grid assets, the honest alternative to a work plan is not a tidy preventive program - it is run-to-failure with a calendar patrol on top.
The individual line items are more persuasive than the percentages. In the 345 kV campaign above, the highest-consequence repair - a suspension clamp with its load-bearing nut backed off and the cotter key gone - cost about $15,000 to fix. In the separate HVDC program, the single averted failure was valued at $1M+ in forced-outage revenue alone. Different jobs, same shape: small hardware costs on one side, seven-figure consequences on the other. That gap is where the ROI of AI asset inspection compounds - through avoided rework, fewer truck rolls, and deferral risk you can finally see.
What is the best predictive intelligence software for power grid assets?
The best predictive intelligence software for power grid assets is the one that turns your own visual data into a decision-grade work plan: ranked, costed, evidence-attached, and delivered into the systems your planners already use. Judge candidates by that output, not by model claims.
Six capabilities separate software that produces work plans from software that produces dashboards:
| Capability | What decision-grade looks like |
|---|---|
| Per-asset condition record | One queryable history per structure, absorbing drone, truck, and ground capture alike |
| Risk ranking | Severity plus consequence weighting - not a confidence score wearing a costume |
| Expert validation | A named reviewer on every finding that could become a work order |
| Cost-consequence view | Repair estimates beside the failure exposure they remove |
| Systems output | Work orders in the EAM, layers in the GIS - not exports that die in a folder |
| Audit trail | Any line item traceable to its image, location, and reviewer |
Detect builds DetectOS around exactly this layer. AI screens the full image volume; named engineers validate what matters - the Hybrid AI + Expert Review model - and the output is a severity-ranked queue per structure, landed in the EAM and GIS tools a utility already runs, with SOC 2 Type II attestation behind the data handling. For a structured comparison across vendors, score candidates with the seven-criterion platform scorecard - the work-plan test above is the executive shortcut through it.
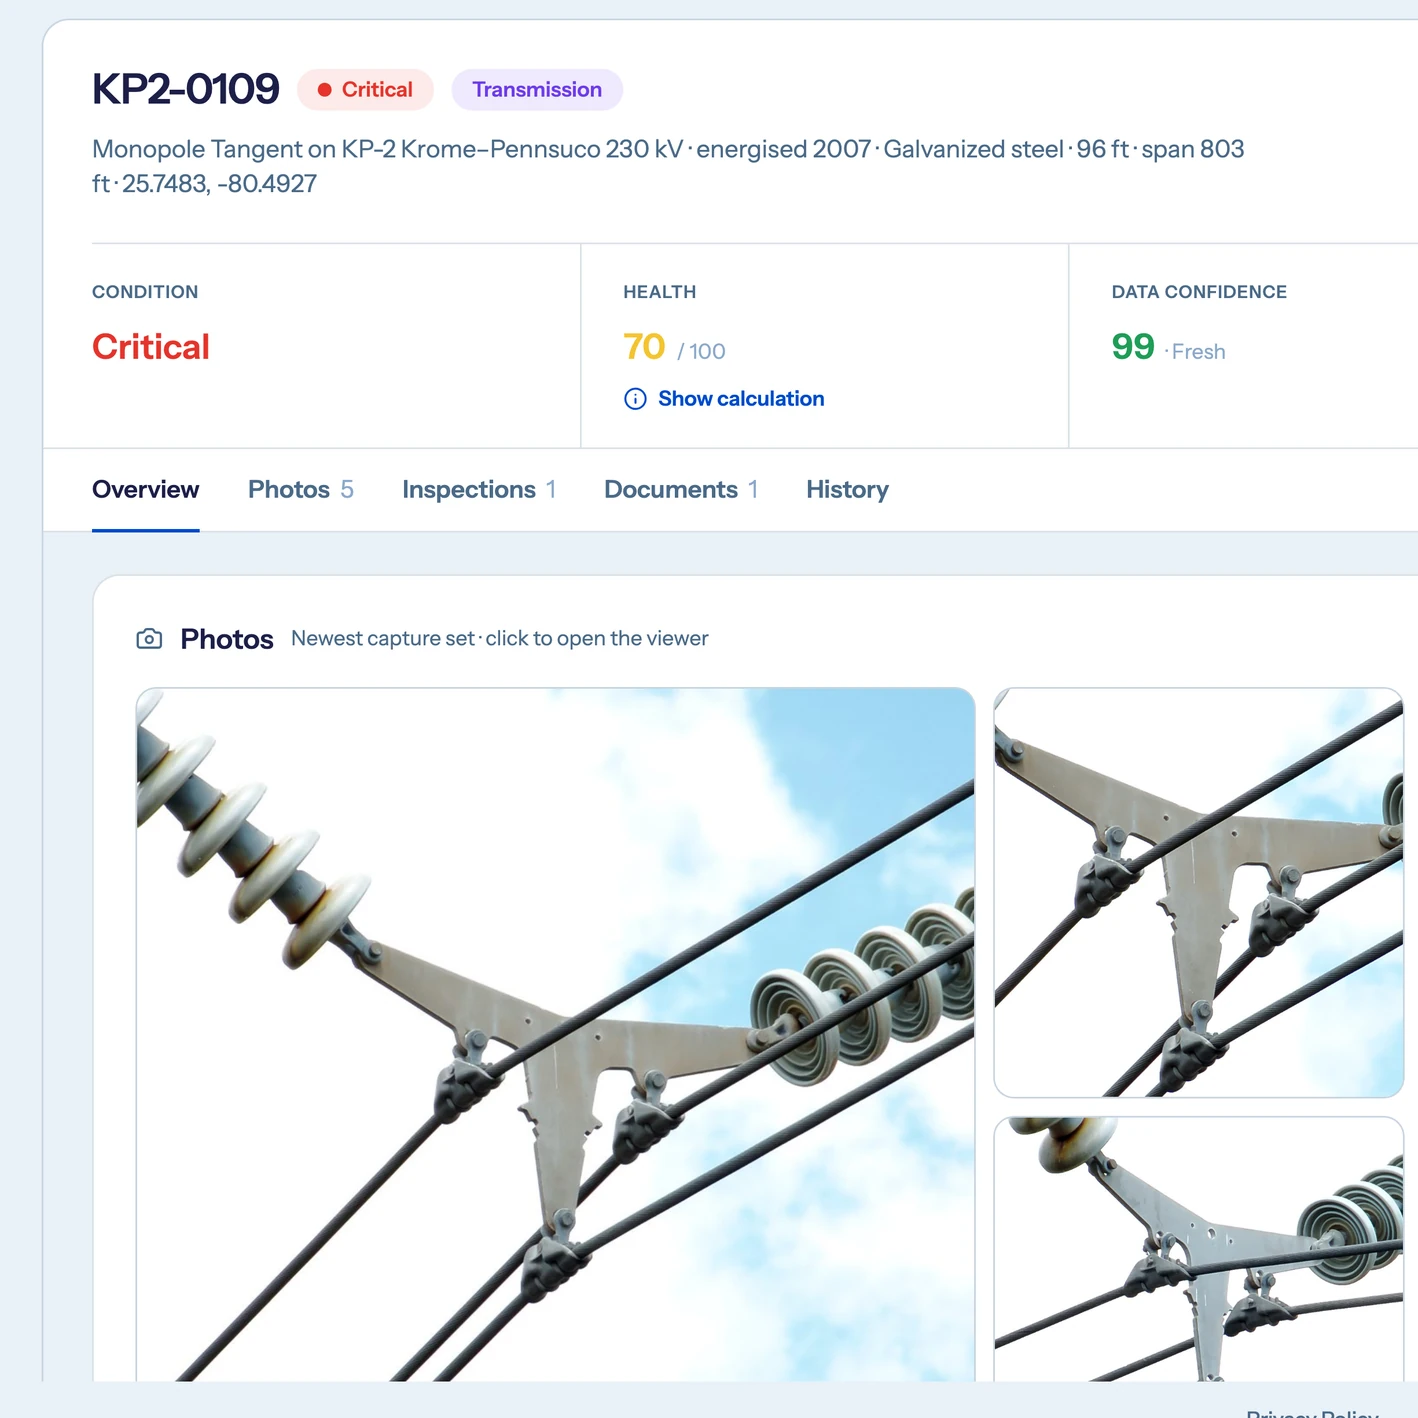
The record a plan is built from: condition, health score, and data confidence per structure in DetectOS (demo environment).
- Pick one region and pull last cycle's validated findings. One corridor or district is enough. Start from findings a named reviewer has confirmed - not raw detections.
- Score severity and consequence per structure. Severity comes from the finding; consequence comes from what the structure carries and what fails downstream of it.
- Cluster findings into work packages. Crews travel. Findings that share a line segment or an access road share a truck roll - package them together.
- Price each package beside its failure exposure. A repair estimate means little alone. Put it next to the outage, fine, or rebuild it prevents.
- Present the ranked plan with evidence attached. Every line item carries its image, location, and reviewer - then land approved items straight in the EAM.
The work plan is the deliverable
The grid's biggest maintenance problem was never a shortage of data. It is that most inspection data never becomes a decision. Imagery gets captured, findings get filed, and the budget meeting still runs on anecdote and age.
A risk-based work plan closes that loop. It is the difference between "we inspected 96 structures" and "here are the 55 conditions that will cause the next failures, in order, with the evidence and the price." One of those statements waited a decade for funding. The other was approved in ten minutes.
See your findings as a ranked work plan
Send Detect a recent inspection set. The free audit returns validated findings, risk-ranked - the first page of the work plan your imagery already contains.
Book a free audit →