
How Same-Day AI Triage Prioritizes Grid Defects
The short version. Same-day AI triage grades inspection imagery, analyzes it, and ranks every finding by severity and component criticality on the same day the images are captured - so the highest-risk defects reach a crew while the condition still matches the picture. It is the capability that turns an AI visual asset inspection platform for utilities from a report generator into a decision engine.
Key takeaways
- The bottleneck in utility inspection is analysis, not capture. As much as 40% of inspection imagery is unusable, and the typical lag from capture to action runs three to six months.
- Same-day AI triage ranks defects by severity times component criticality on a 0 to 25 scale, sorting them into Immediate, Scheduled, and Routine tiers before engineering review begins.
- On one new 345 kV program, triage sorted 45,335 findings across 927 structures the same day and placed 59 in the Immediate tier.
- Faster, ranked findings improve reliability by sending crews to the highest-risk components first. One same-day catch prevented an outage estimated at more than seven days and protected over $1 million in exposure.
- The capability that separates platforms is decision-grade quality: grading imagery before analysis, ranking by consequence, and working with any capture source.
By the numbers
- Up to 40% of utility inspection imagery is unusable somewhere in the pipeline.
- 3 to 6 months is the typical lag from capture to action.
- ~2 towers per second : the pace of the AI analysis step, which collapses weeks of manual review into the same day.
- 0 to 25 is the scale DetectOS uses to score defect severity times component criticality.
- 45,335 findings were triaged across 927 structures on one 345 kV program; 59 landed in the Immediate tier.
- 258 defect types sit in Detect's transmission catalog. A sharp image exposes all of them; a blurry image exposes 7%.
- 7+ days of outage prevented and $1M+ in exposure protected by a single same-day catch.
- ~$121 billion : the estimated cost of U.S. power outages in 2024, up from ~$52 billion in 2018 (Oak Ridge National Laboratory).
Utilities have never captured more inspection imagery. Drone fleets scaled fast. The capacity to analyze what they bring back did not. The result is a backlog: terabytes of images waiting on review while the assets in them keep aging.
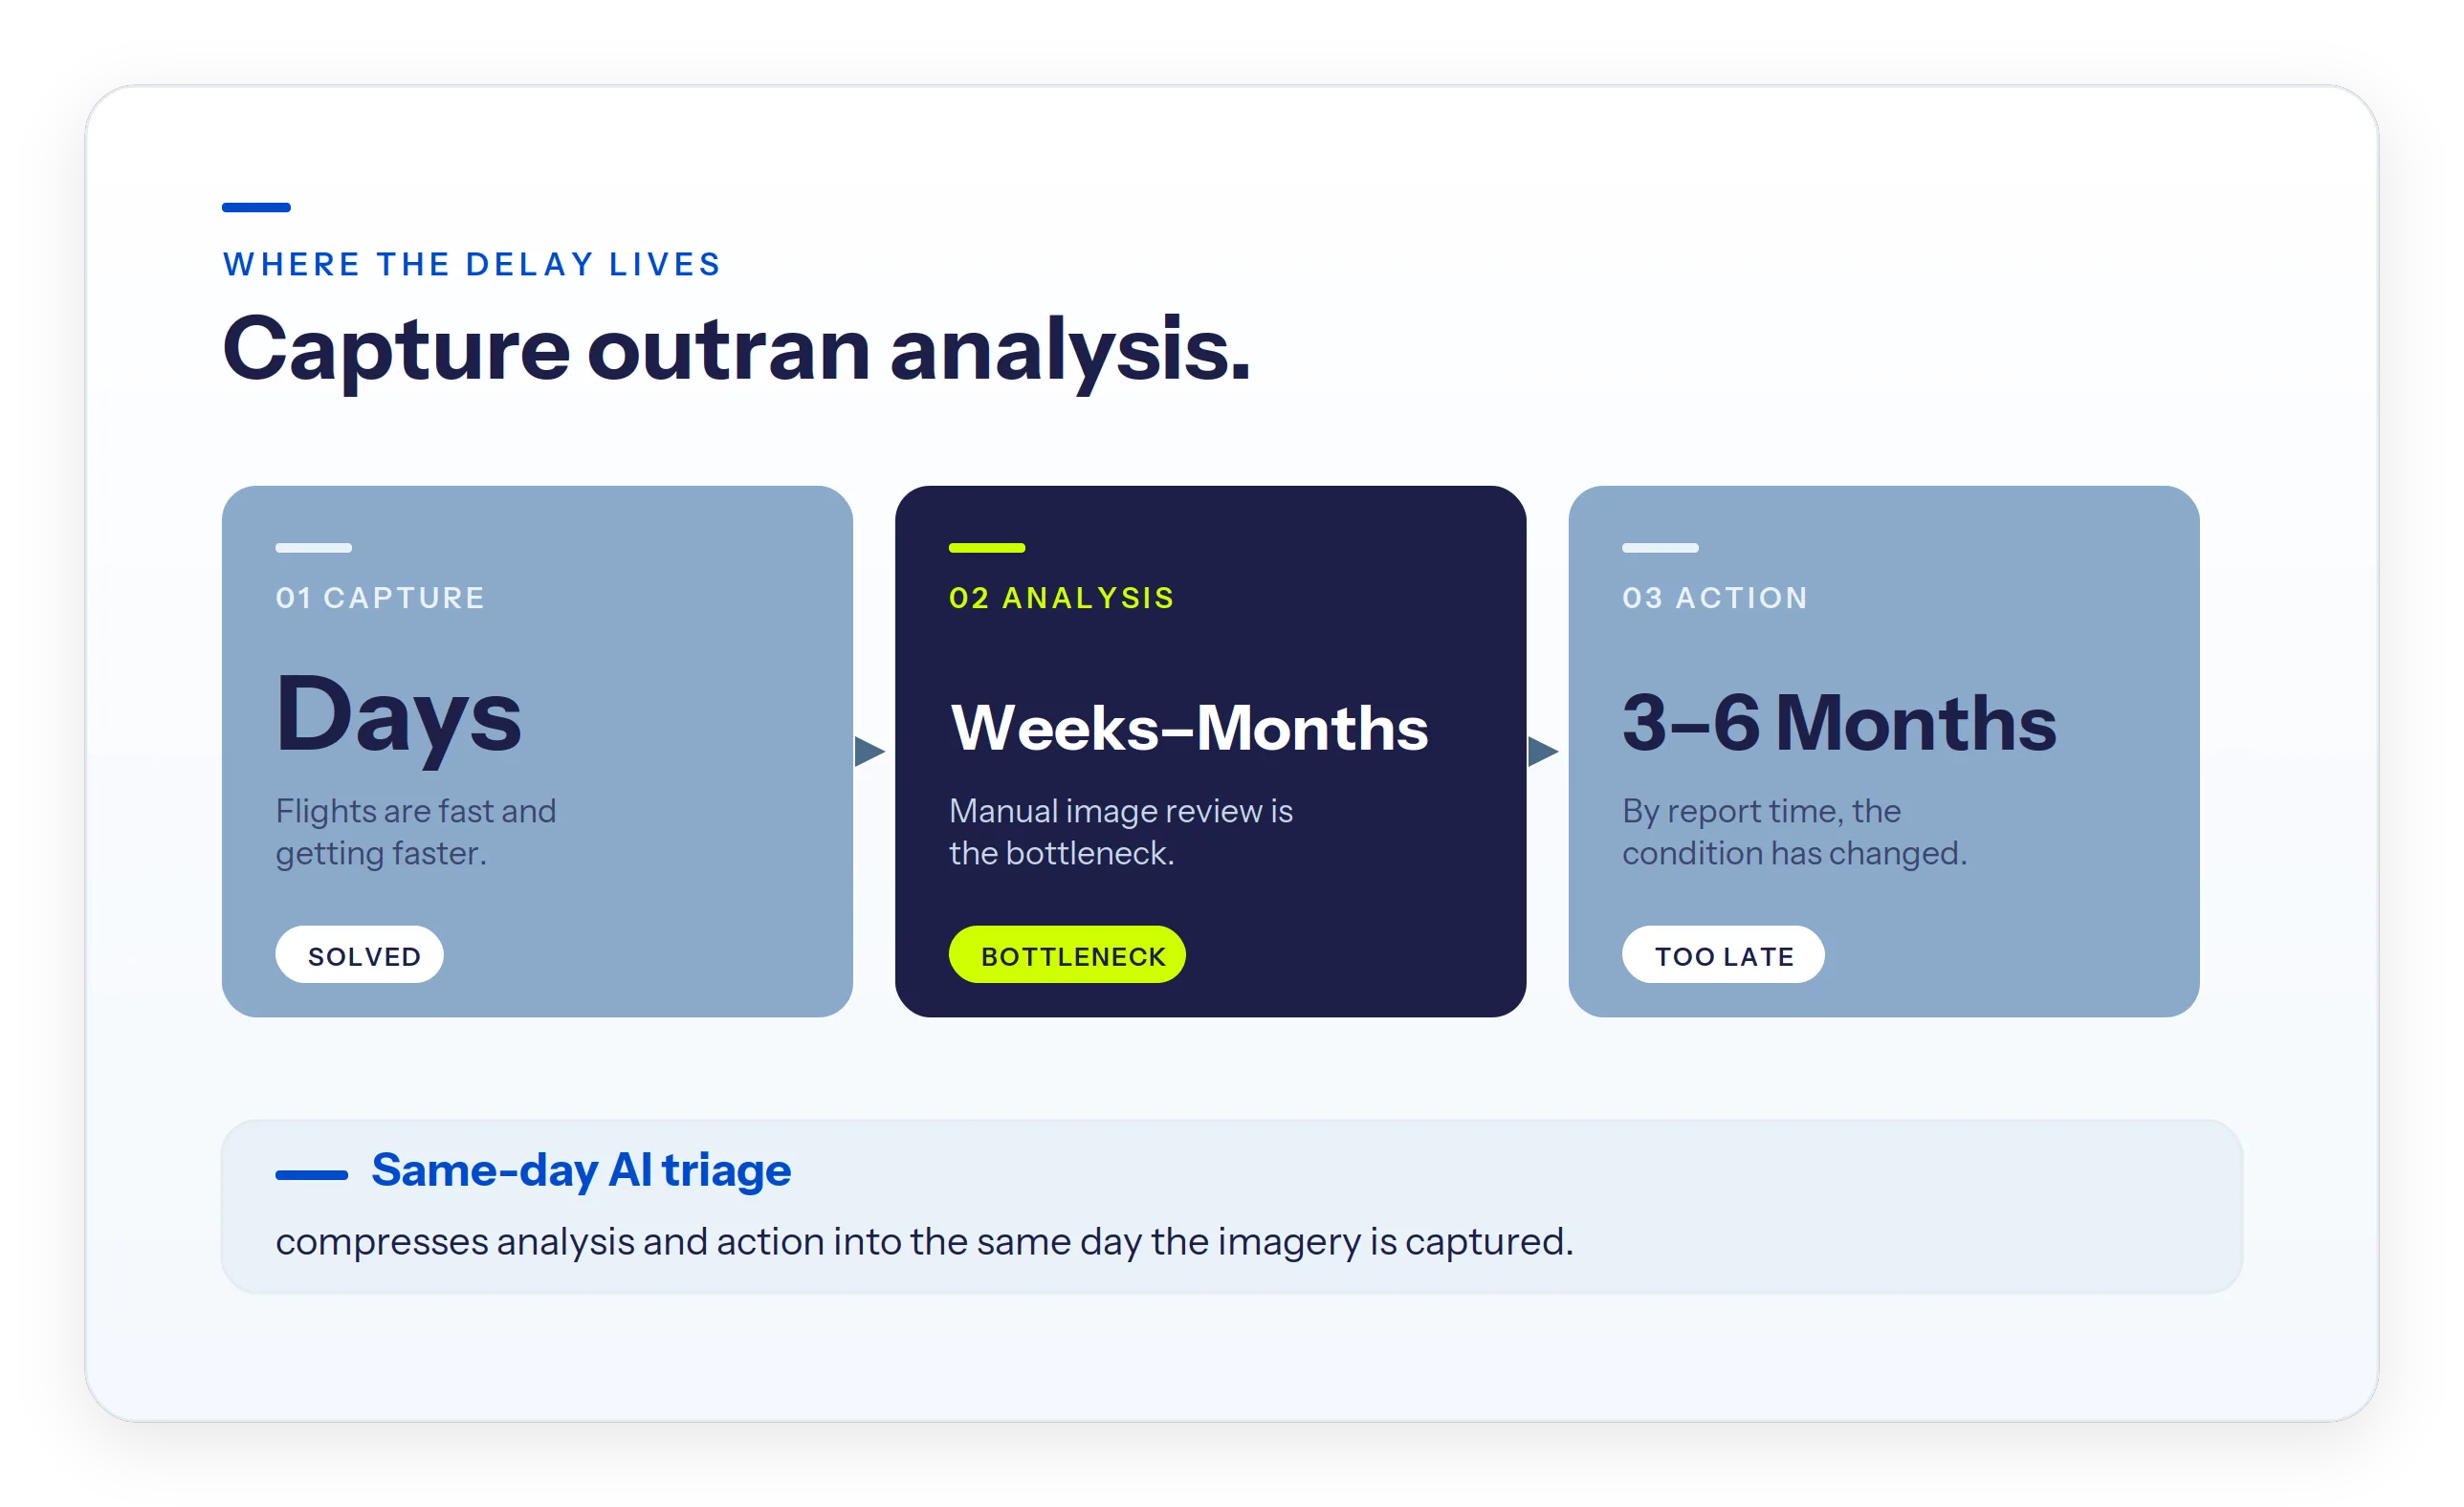
The gap between an inspection and a decision is now measured in months. On the grid, months are long enough for a flagged condition to become an outage.
An AI visual asset inspection platform for utilities is meant to close that gap. The platforms that do share a single capability. They turn raw imagery into severity-ranked findings the same day it lands, so crews move while the condition, the weather, and the season still match the picture. That capability is same-day AI triage. It is the difference between a platform that produces reports and one that produces decisions.
Why utilities struggle to use visual inspection platforms
The hard part was never getting the pictures. Drones, helicopters, and field crews can cover a corridor quickly. The hard part is what happens next.
Three problems sit between an inspection and a decision.
Inspection data quality: up to 40% of imagery is unusable
As much as 40% of utility inspection imagery is rejected or unusable somewhere in the pipeline. Too soft, too dark, or missing the component that mattered. A model cannot find what the pixels do not contain.
The analysis backlog behind every drone program
Manual image review runs weeks to months. A single transmission program can produce more than 100,000 images. Analysts work through them while the queue grows behind them. The gap compounds across a portfolio: Duke Energy, for example, inspects roughly 20% of its 4.3 million poles a year - about one pass every five years.
Time-to-action: the three-to-six-month lag
The typical lag from capture to action runs three to six months. A loose fitting flagged in spring becomes a work order in fall, and by then the loading, the weather, and the season have changed. Close to half of infrastructure rework traces back to bad inspection data rather than bad fieldwork: decisions made on a picture that no longer matched the asset.
What the gap costs in grid reliability
The cost of that gap shows up in reliability, and the assets in question are not new. Roughly 70% of transmission structures in North America have already passed their original design life, so a delayed finding often lands on hardware built for an era that has ended.
The trend in the data is not reassuring. The U.S. Energy Information Administration reported that 2024 brought the most hours without power in a decade, driven by major storms including Hurricanes Beryl and Helene. The average U.S. distribution customer lost 335.5 minutes of power across all events in 2022, and reliability has declined over the past decade. Oak Ridge National Laboratory puts the annual cost of U.S. power outages near $121 billion in 2024, up from roughly $52 billion in 2018.
A platform that produces a report six months after capture does not move those numbers. A platform that produces a ranked decision the same day can. That is the case for power grid asset inspection built around triage rather than reporting.
What is same-day AI triage?
Same-day AI triage is the practice of grading inspection imagery, analyzing it, and ranking every finding by how much it matters and how soon - all on the same day the images are captured. The word comes from emergency medicine, where triage means sorting by urgency before you treat. Applied to grid inspection, it means a maintenance team starts the day with a ranked list, not a folder of images.
Three things happen in sequence.
Step one: grade the imagery before analysis
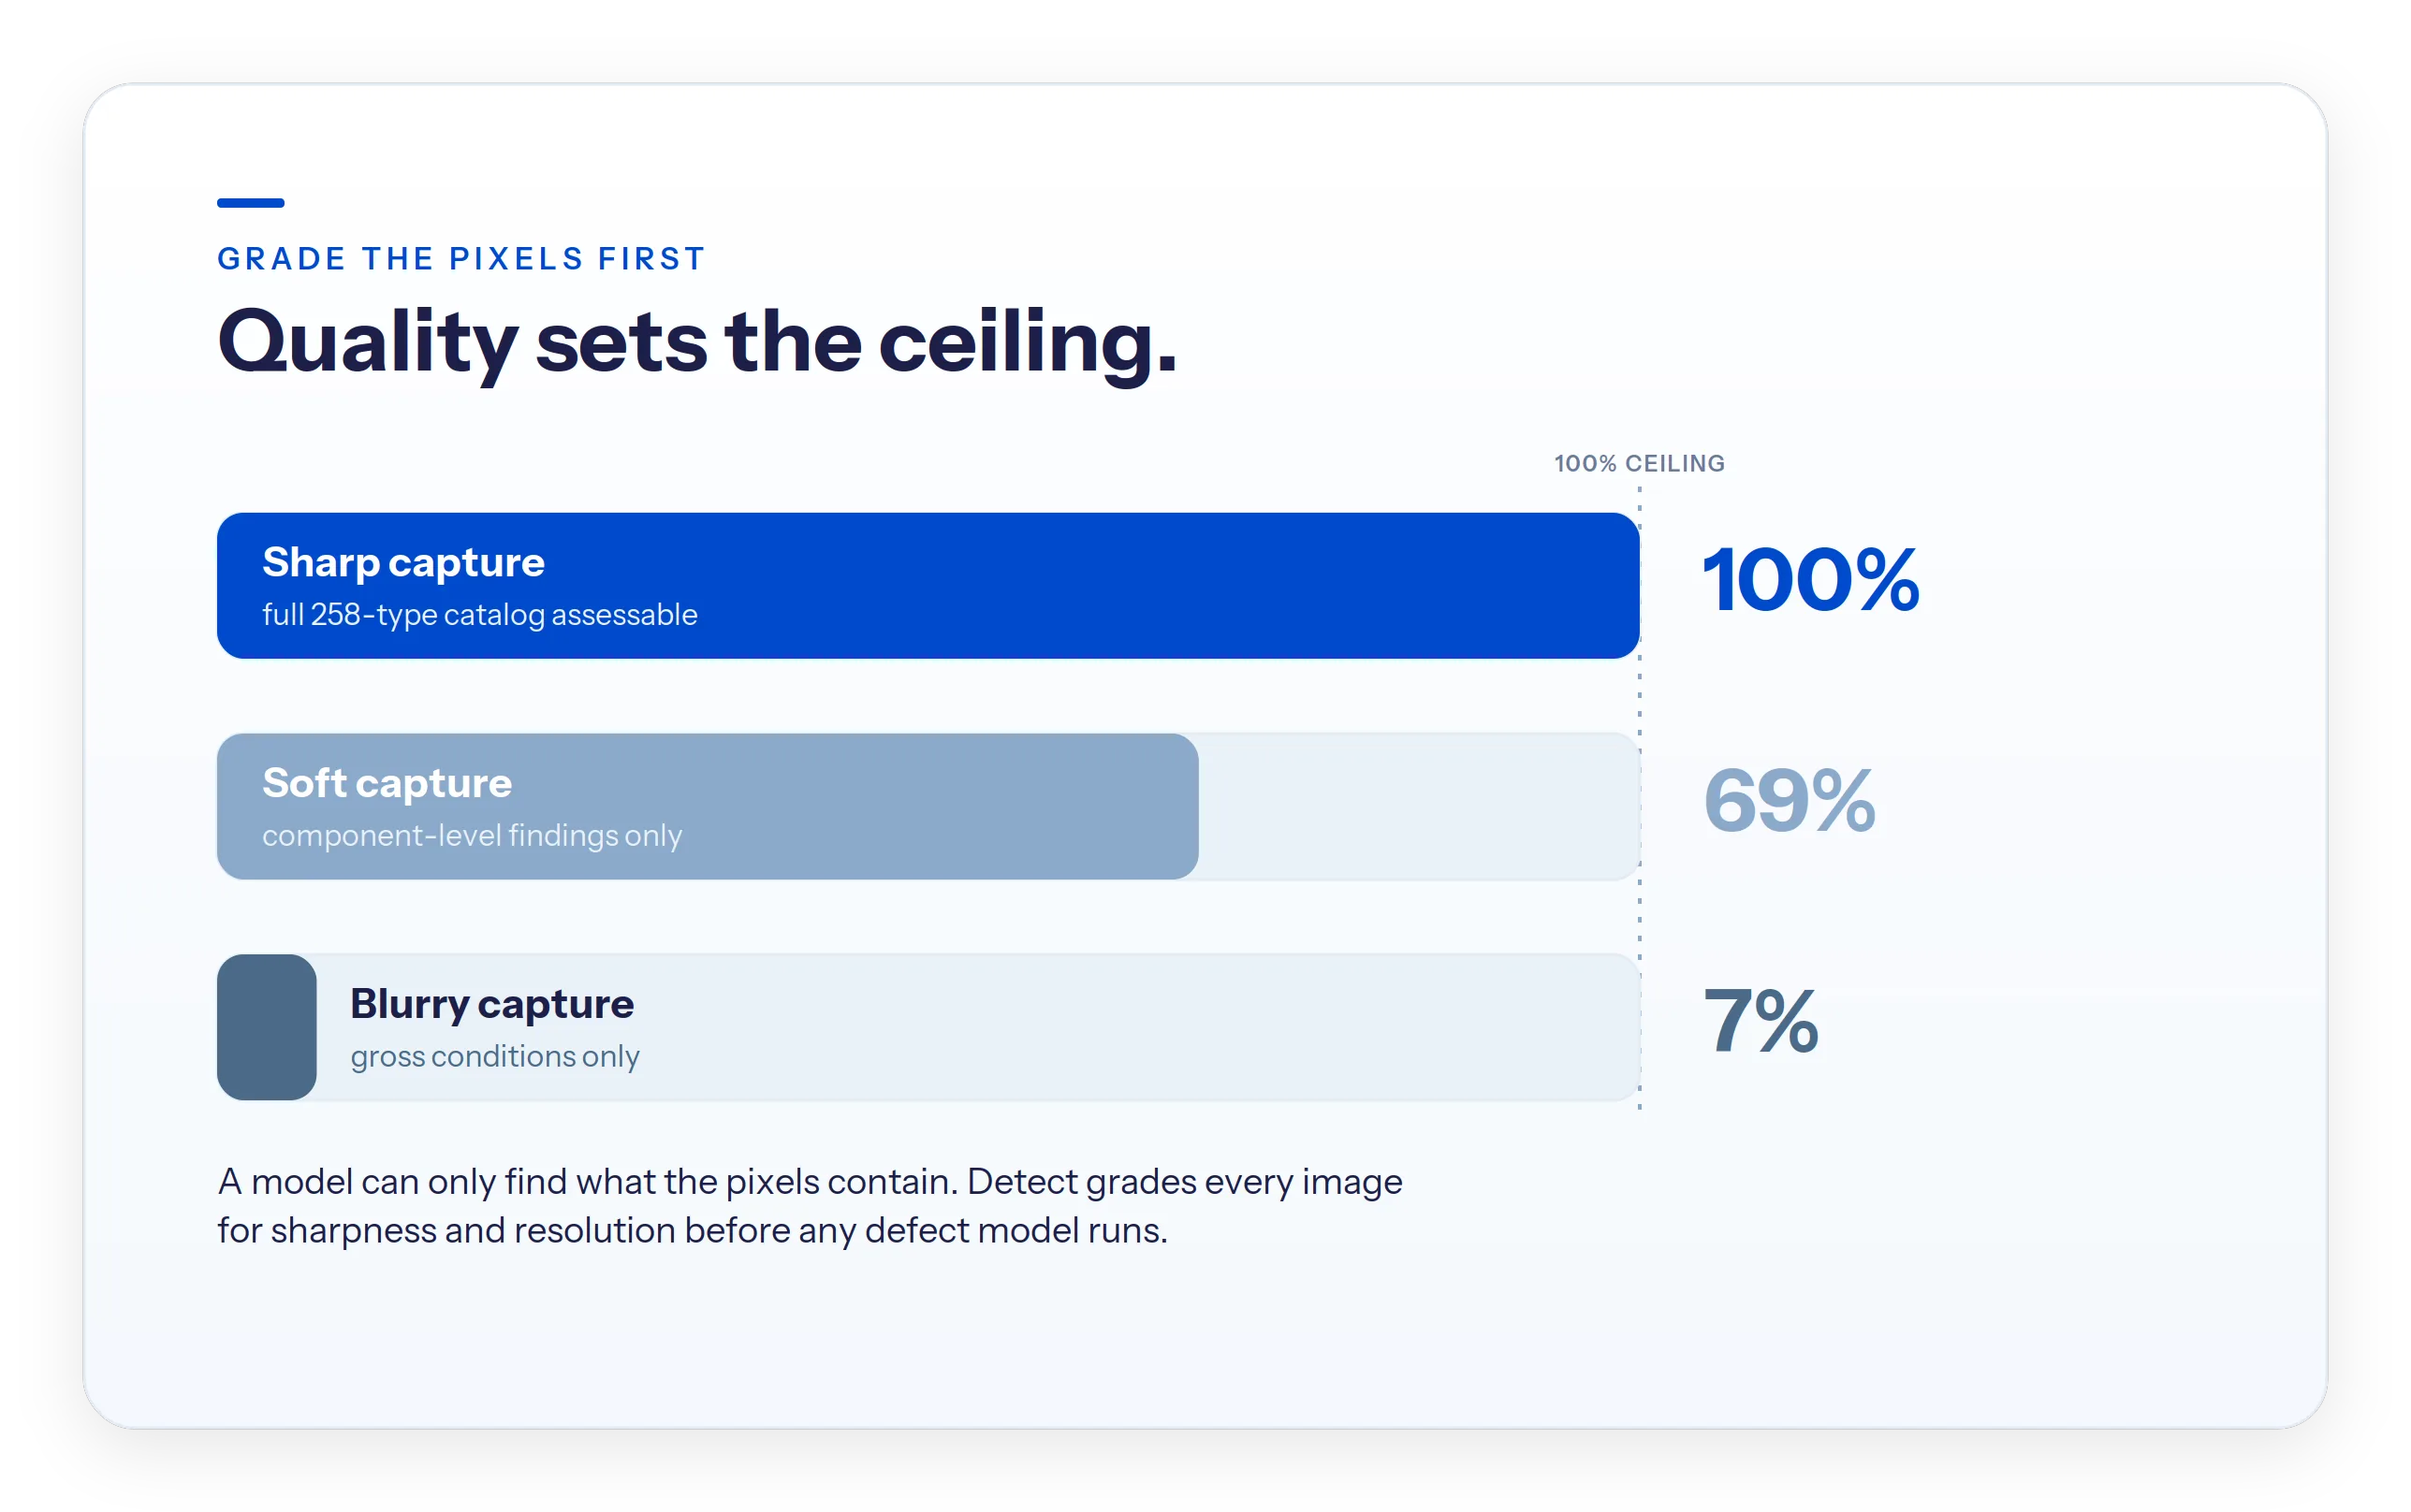
Before any defect model runs, each image is scored for sharpness and effective resolution. This matters more than it sounds. On Detect's transmission catalog of 258 defect types, a sharp image exposes the full catalog. A soft image exposes about 69% of it. A blurry image exposes 7%. The fastener- and splice-level defects that drive reliability are the first to vanish when capture quality slips. Grading first means analysis runs on what is actually assessable, and weak captures are flagged by exception rather than buried in the set. This quality-first grading is the foundation of Detect's Data Quality Program .
Step two: run AI and expert review in parallel
The model does the volume work at machine speed - on the order of two towers per second - which is what collapses the weeks-to-months analysis step into the same day. It sorts tens of thousands of images, flags candidates, and measures what can be measured. Trained analysts then validate the findings that carry consequences, which lets a small bench of senior expertise cover far more assets than a manual review ever could. The AI is the force multiplier. The expert still makes the call.
Step three: flag emergent risk in hours
When the imagery shows something that cannot wait - a backed-off bolt, a cracked insulator, a submerged footing - it does not sit in a queue until the full report is done. It is flagged the same day, with the image and the location attached. That is what same-day AI analysis of utility images looks like in practice: not a faster report, but an earlier decision.
What happens when the AI gets it wrong?
This is the question every reliability lead asks, and the honest answer is that the expert layer exists precisely because models miss context. One example from a new transmission program: on the first day of labeling, an analyst flagged corrosion on the cut ends of through-bolts in insulator assemblies. The routine call would have been to log surface corrosion and move on. The analyst stopped, because the oxidation pattern was wrong. It matched what happens when field crews cut bolts to length on site and skip painting the cut ends - a construction shortcut, not a material defect. The observation reached the utility within hours, and the contractor changed the practice the next day, before it became a pattern across hundreds of structures. A model finds what it was trained to find. A person recognizes what looks wrong. Same-day triage works because it keeps both in the loop.
How triage ranks a defect: severity times criticality
A loose nut is not always a loose nut. On a bird diverter, it is a housekeeping note. On a primary conductor clamp, it is a reliability risk. Any ranking that treats those two the same is not a ranking.
How the 0 to 25 priority score works
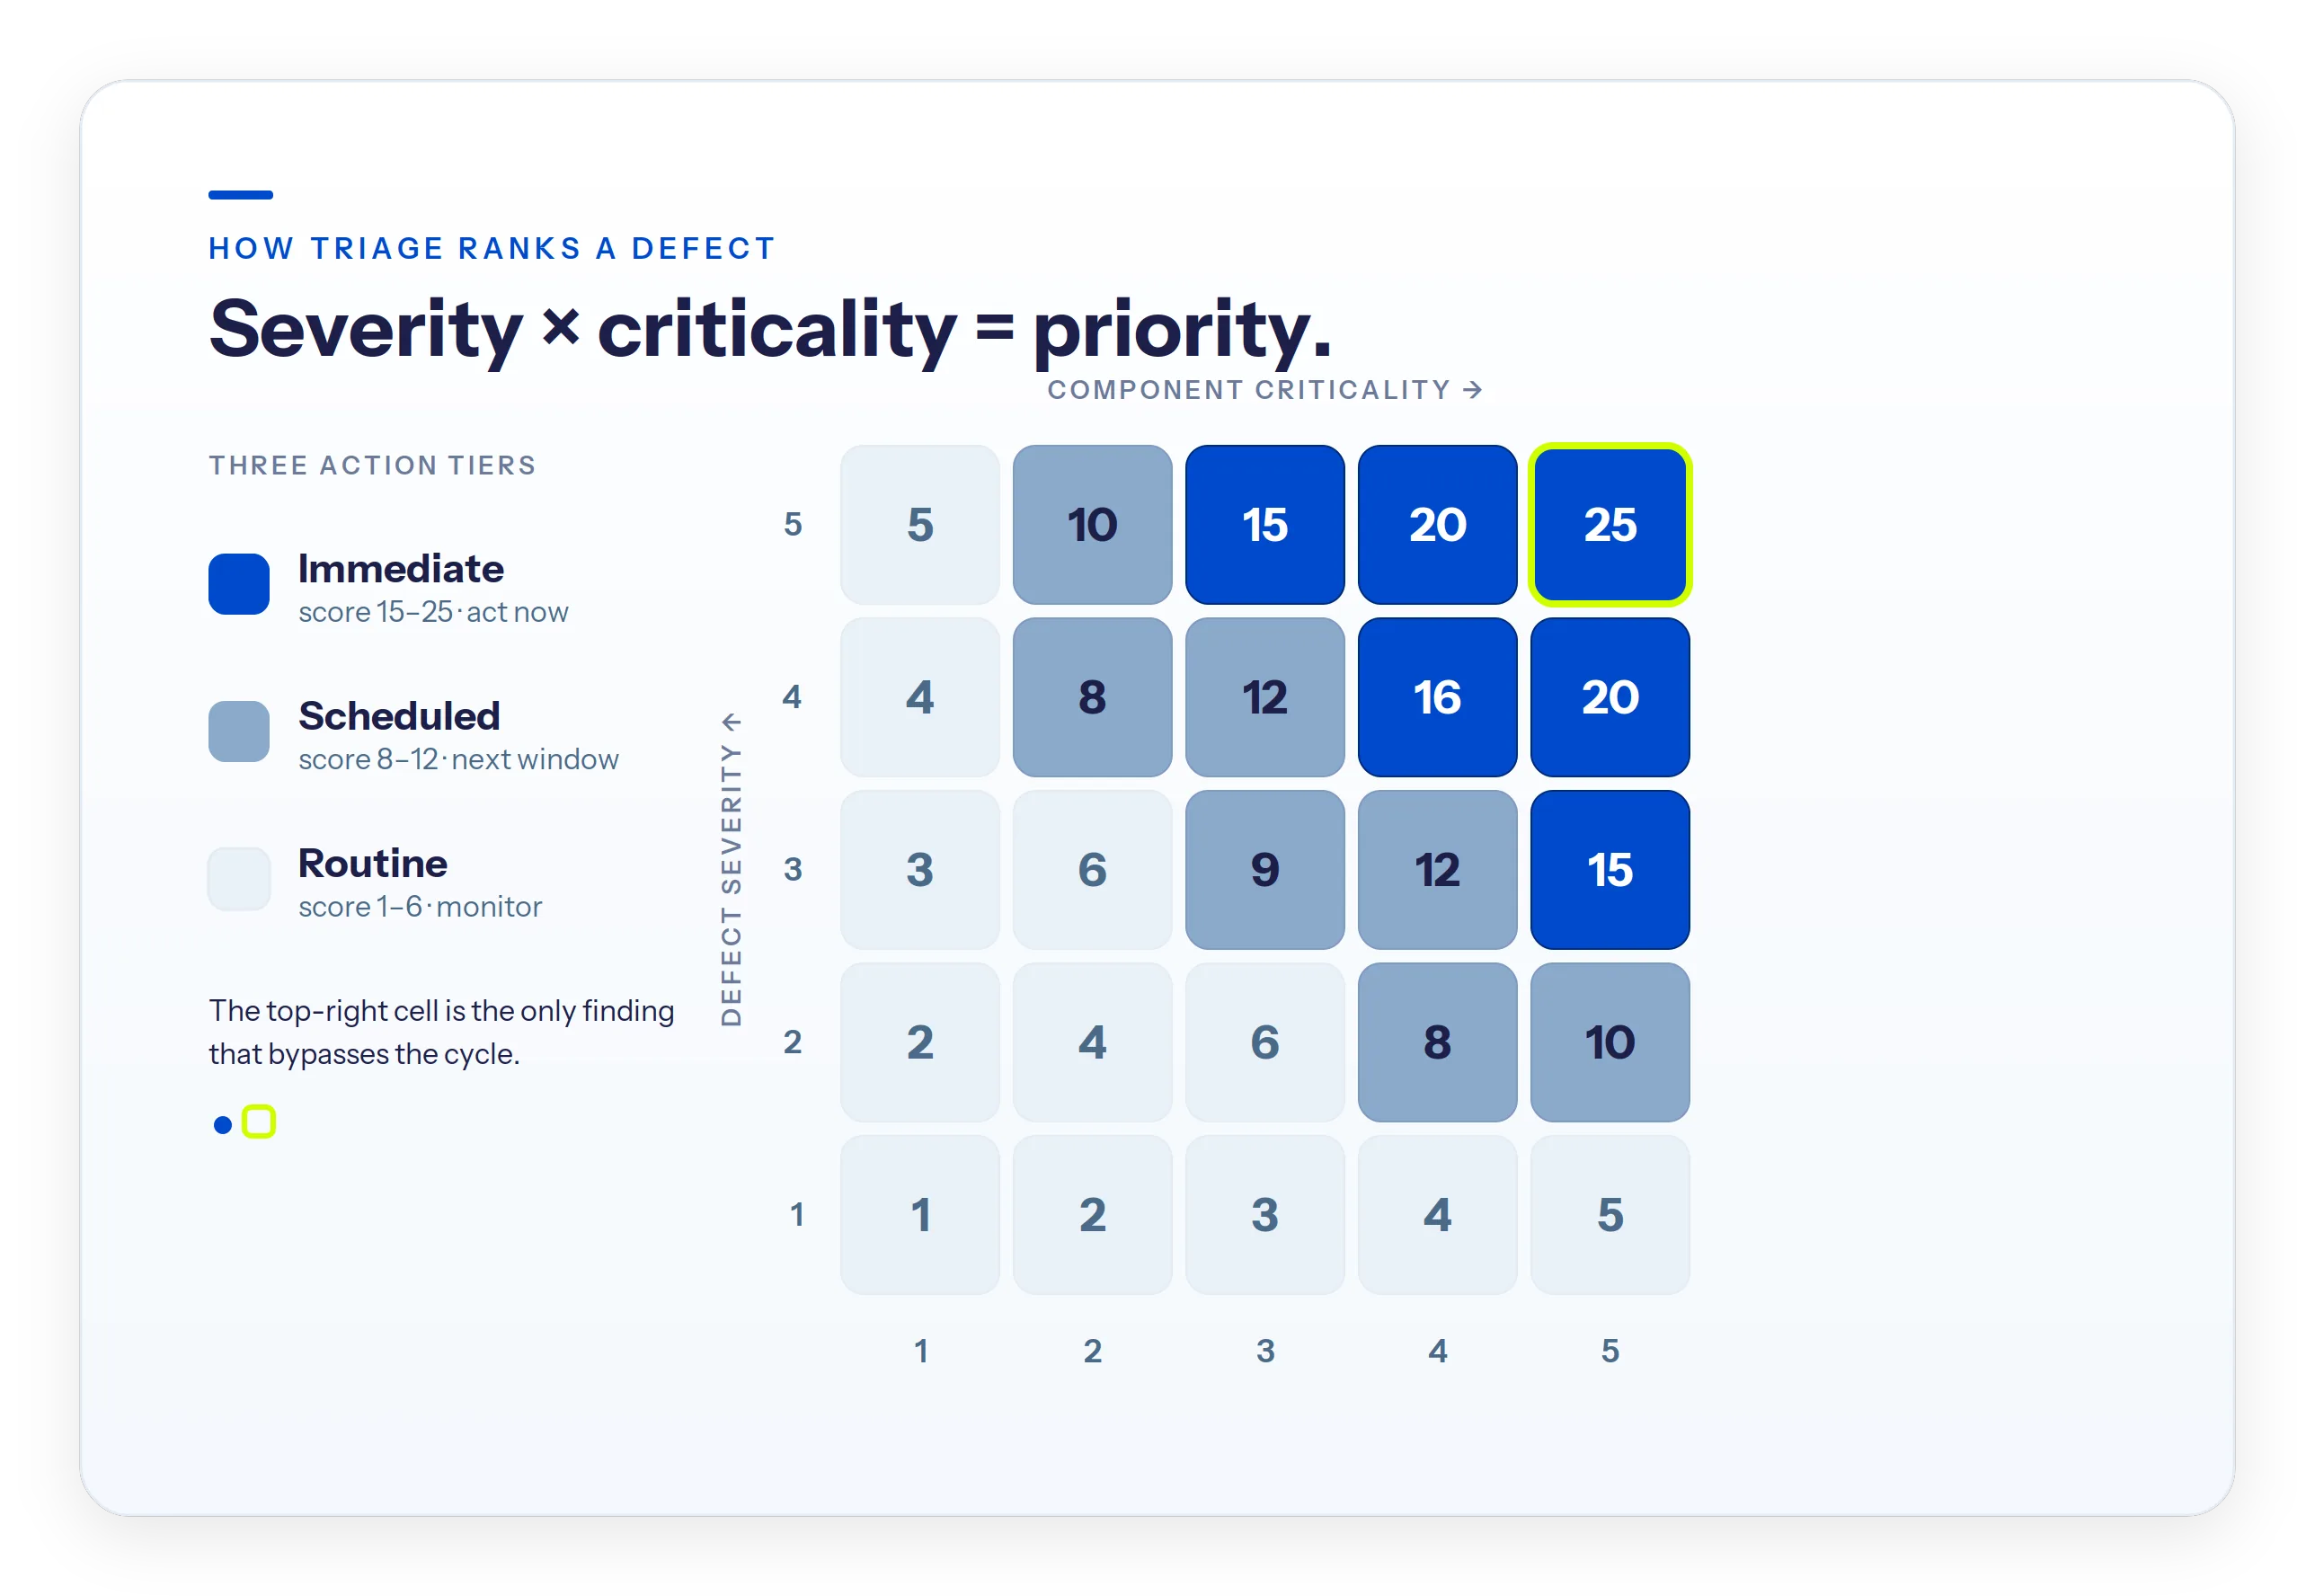
DetectOS scores each finding by multiplying defect severity by component criticality on a 0 to 25 scale. Severity is how bad the condition is. Criticality is how much the component matters to keeping the line up. The product is a priority score, and that score sorts every finding into three tiers:
- Immediate - act now, outside the normal cycle.
- Scheduled - fix on the next planned window.
- Routine - log against the baseline and monitor.
The three triage tiers: Immediate, Scheduled, and Routine
The numbers from one new 345 kV transmission program show the shape of it. Analysts logged 45,335 findings across 927 structures. The triage placed 59 in the Immediate tier, 12,362 in Scheduled, and 31,761 in Routine. It finished before engineering review started.
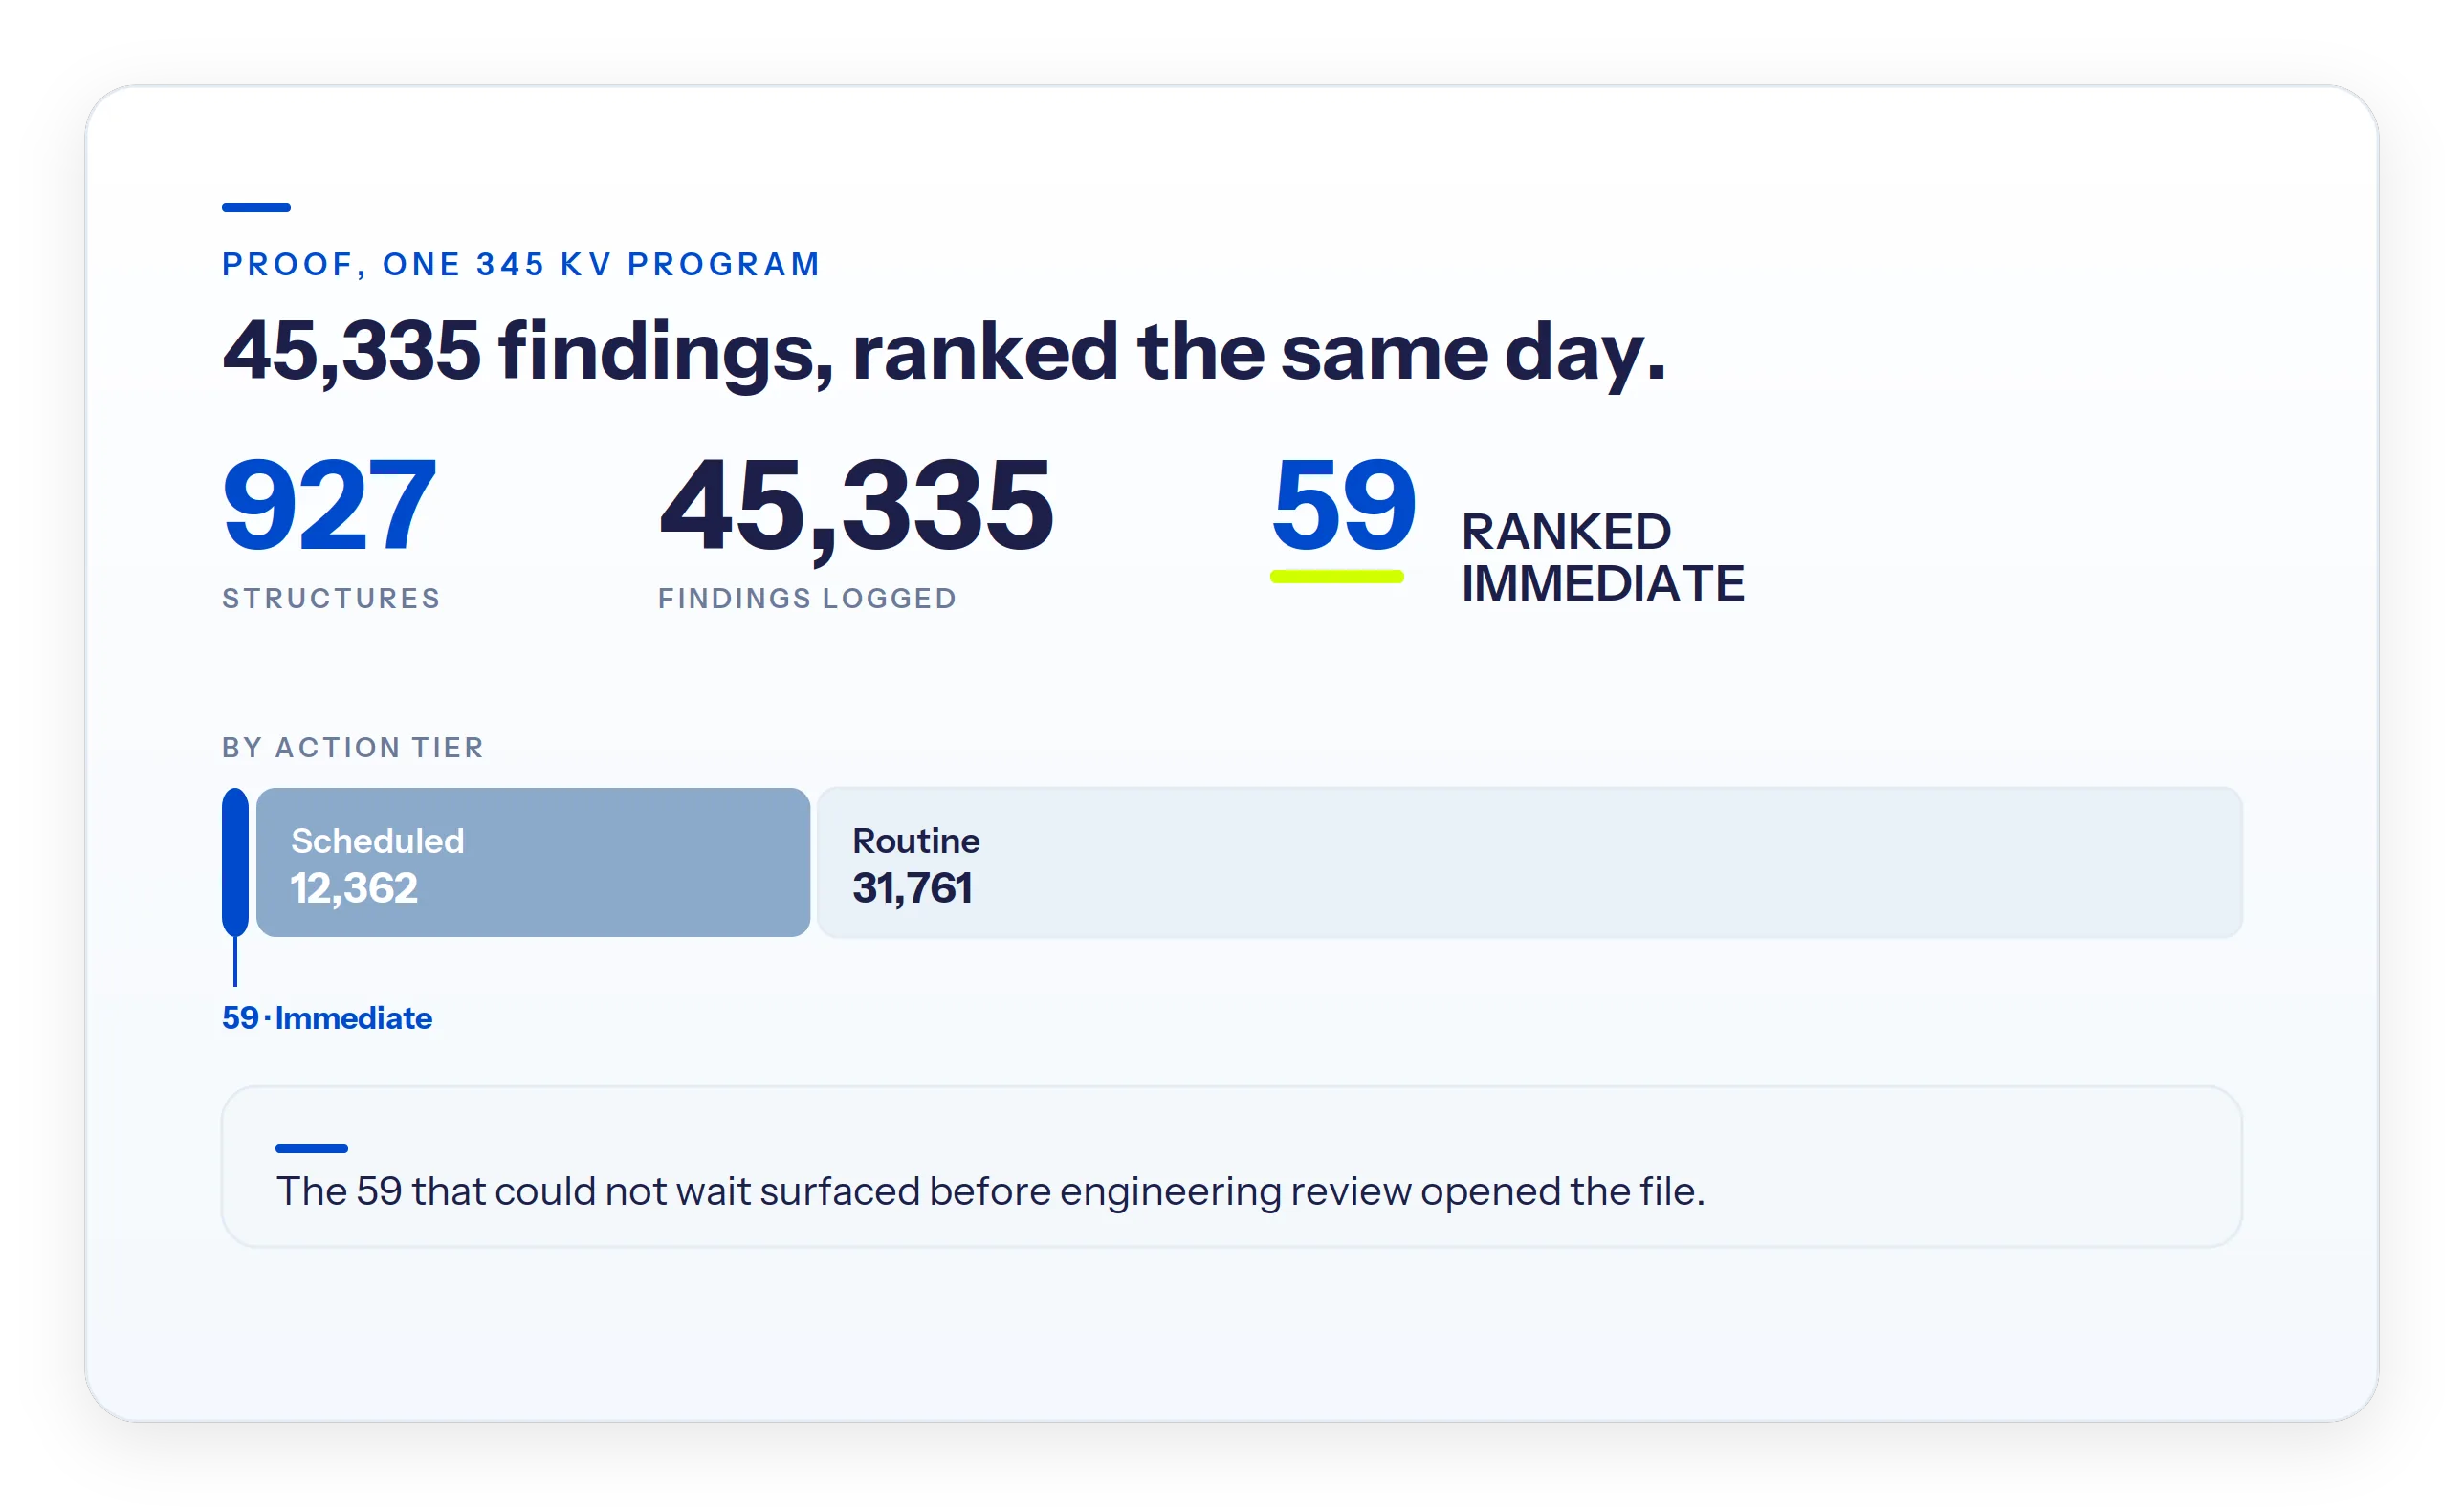
That sequence - ranked before a human opens the file - is what lets a maintenance team decide where to send crews first. The alternative is reading 45,000 findings to locate the 59 that cannot wait. More on risk-based transmission inspection is in our transmission line inspection guide.
How same-day triage improves grid reliability
Reliability is won or lost in the time between knowing and fixing. Same-day triage compresses that time.
How early detection prevents unplanned outages
Consider one finding from a summer inspection of 2,600 lattice towers. High in a suspension assembly on an HVDC span, the imagery showed a clevis bolt backed off with its cotter key gone - a few threads from letting go. Under wind or ice load, that hardware could have dropped, risking a conductor fall and a trip on a major line.
Because the risk surfaced the same day, the utility scheduled a brief planned outage instead of absorbing a forced one later. One crew. 120 minutes of field time. The right replacement part staged in advance. The repair prevented an outage estimated at more than seven days once crane mobilization and re-energization testing were counted, and it protected more than $1 million in exposure.
That is the reliability mechanism in a single finding. Multiplied across a portfolio, same-day ranking does three things for an asset manager:
- Sequences the work so crews reach the highest-risk components first, not the ones that happen to be nearest the road.
- Builds the record as a structured, image-linked dataset that feeds the reliability indices utilities report under IEEE 1366 - SAIDI and SAIFI - along with state wildfire filings.
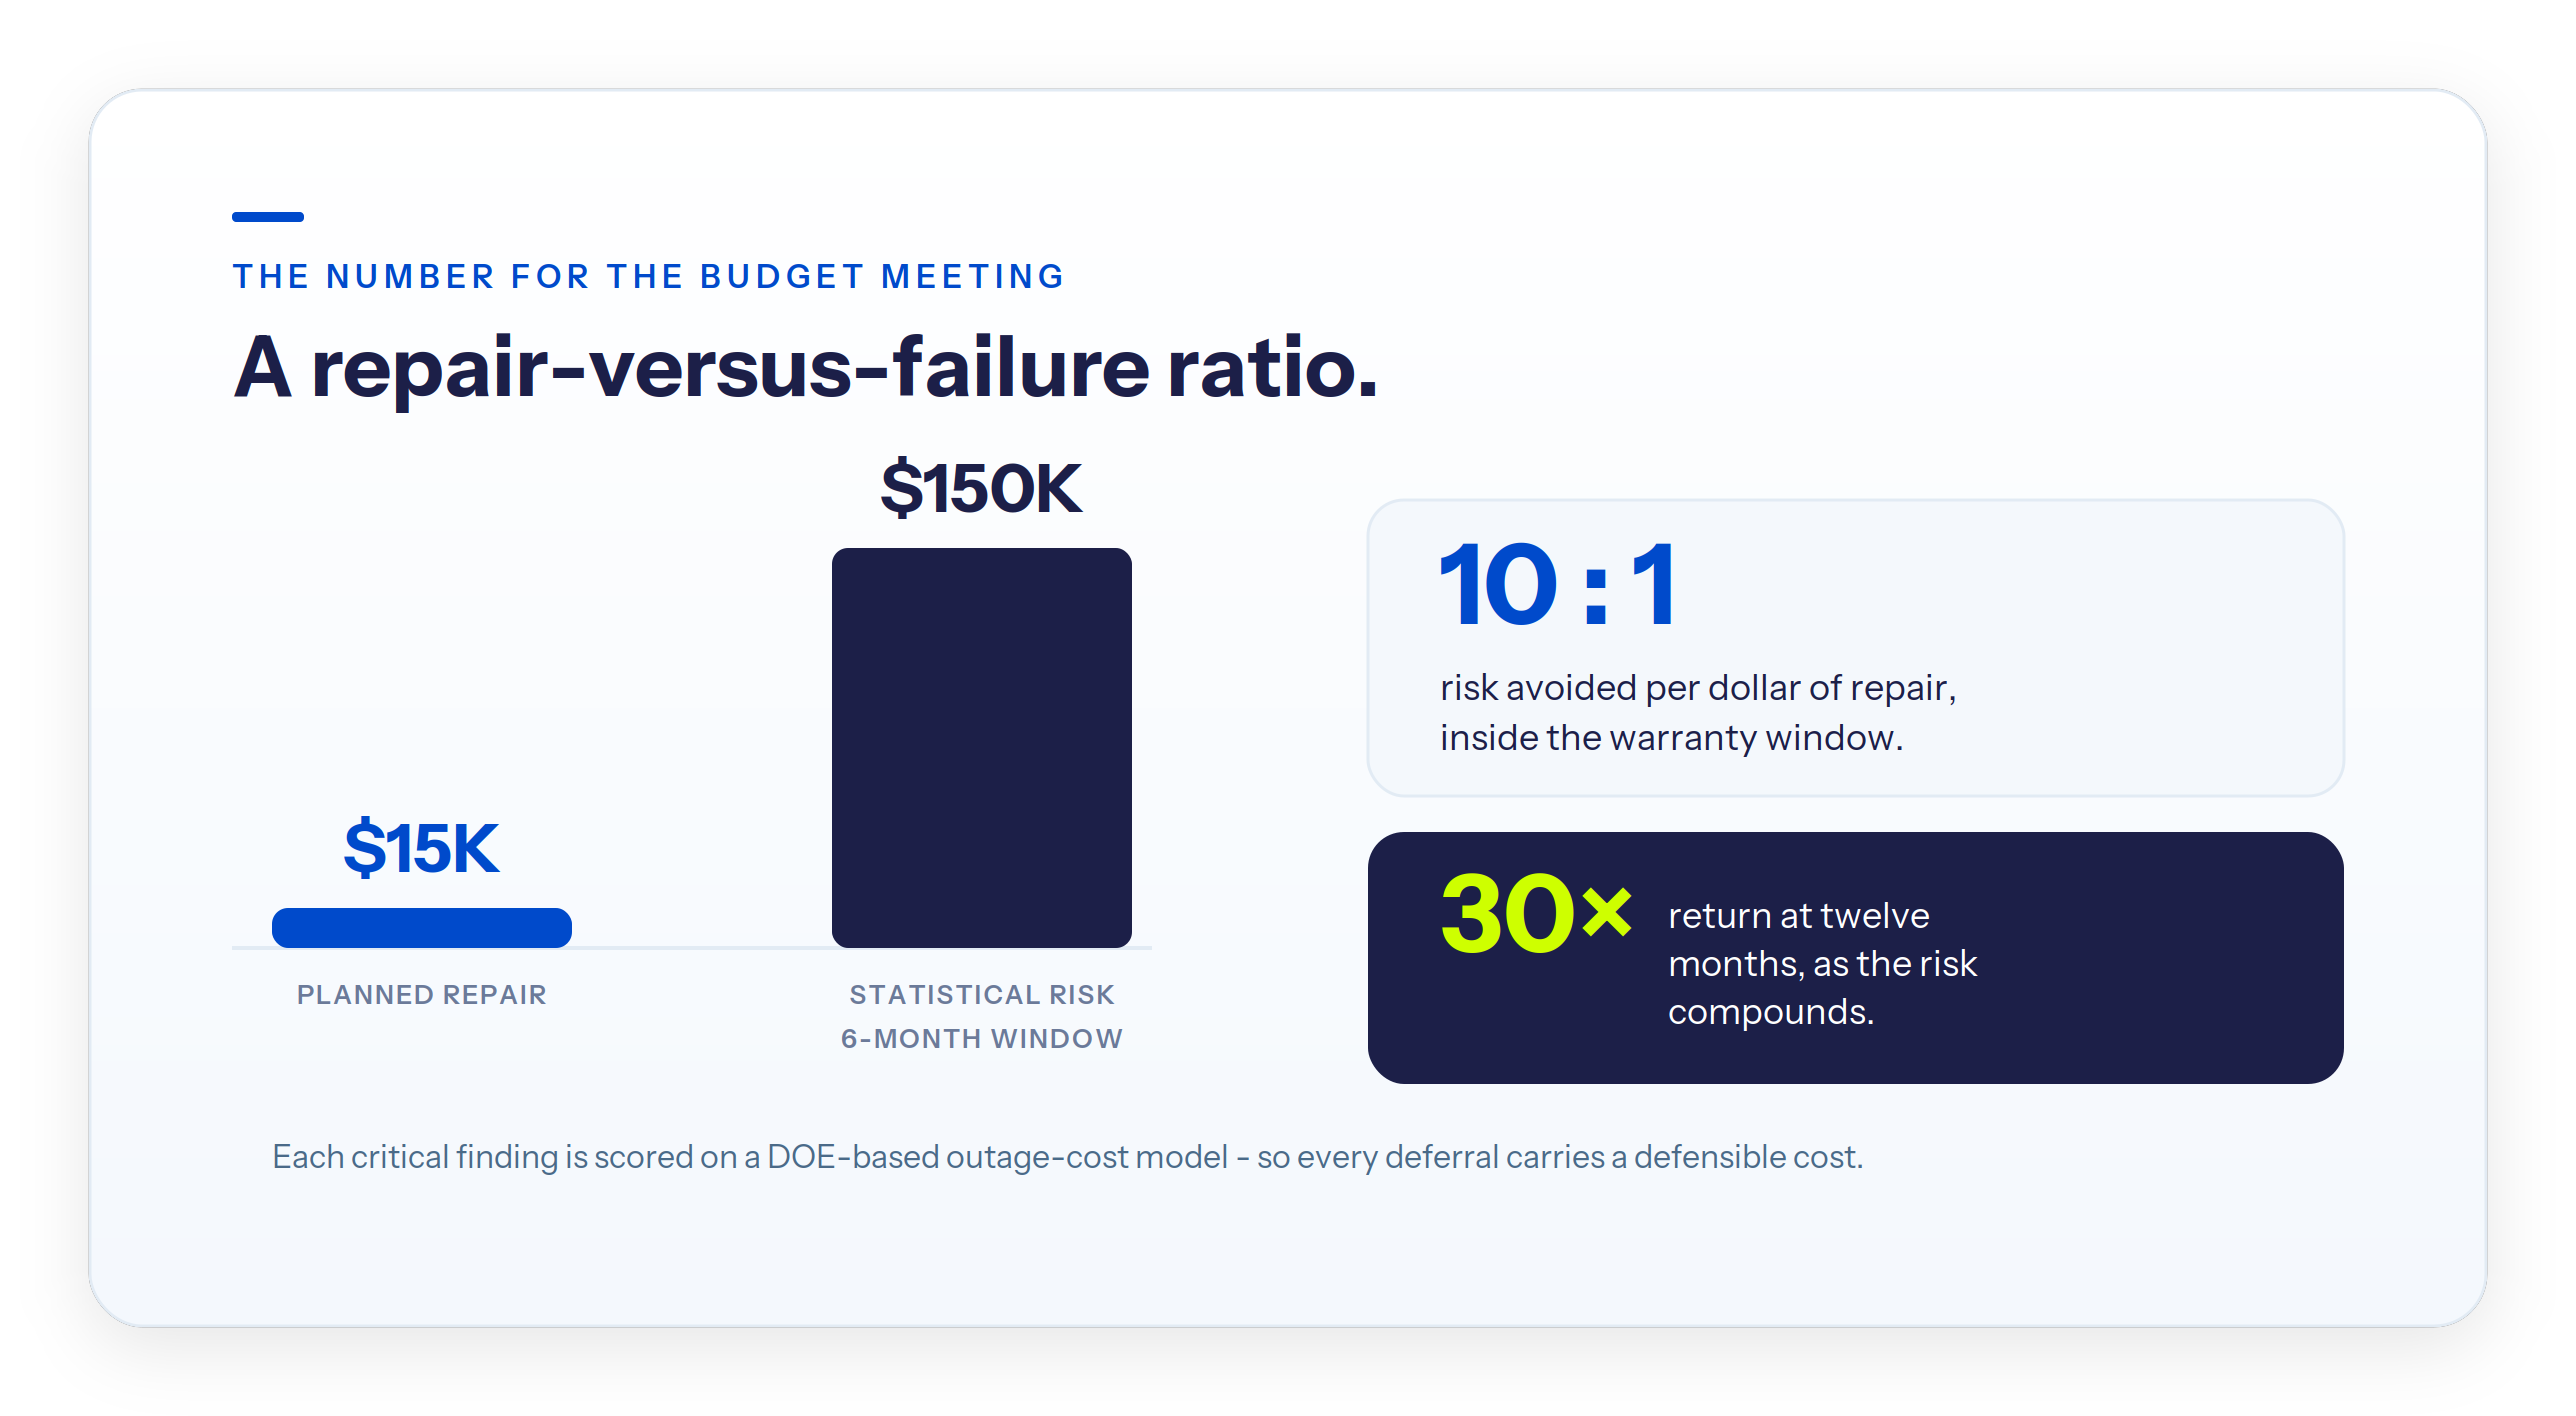
- Quantifies the decision so every deferral or repair carries a defensible cost basis.
Failure-to-repair economics for capital planning
The number matters for capital planning. On that 345 kV program, Detect's reliability team ran each critical finding through an outage-cost calculation built on U.S. Department of Energy methodology. One representative case: a $15,000 planned repair offset roughly $150,000 of statistical risk inside the six-month warranty window. At twelve months, the same repair carried a thirty-fold return. Predictive maintenance for grid assets stops being a slogan when every finding carries a repair-versus-failure ratio you can take to a budget meeting.
The same ranked condition data reaches past the work order into capital strategy, which is where asset managers spend most of their attention:
- Replacement timing. Condition trending forecasts when a retirement unit - an insulator string, a cross arm, a conductor section - is approaching end of life, so the capital project is scheduled rather than triggered by a failure.
- Capital versus expense. Under the FERC Uniform System of Accounts, replacing a retirement unit is capitalized into rate base while a minor repair is expensed. Documented condition feeds that call and the prudency record behind it.
- A defensible baseline. The first inspection sets the as-built condition of record, and every cycle after measures change against it.
Same-day triage in wildfire and HFTD programs
In high fire-threat districts, the clock runs faster. Wildfire mitigation and Public Safety Power Shutoff programs need turnaround measured in hours, because a flagged condition in dry, windy terrain is an ignition question, not a maintenance one. Same-day triage fits that demand directly. On the 345 kV program, the same workflow logged 1,516 proximity hazards - debris, loose equipment, and storm-loosening risks near energized assets - each one a potential ignition source under wildfire scrutiny, and each one image-linked for the filing. For utilities operating under a Wildfire Mitigation Plan, the same ranked, documented output that speeds maintenance also defends the program to regulators. Our wildfire mitigation inspection content covers how that documentation comes together.
From triage to predictive intelligence
Triage tells you what to fix today. Prediction tells you what will fail next. The first is the foundation for the second.
Why predictive intelligence depends on a trustworthy baseline
Predictive intelligence software for utilities depends on a baseline you can trust. You cannot forecast how a fitting will degrade if last year's findings were inconsistent between crews, or scored on imagery no one could rely on. Same-day triage produces the opposite. Every finding is image-linked, tied to a specific structure and component, and scored on the same scale across the whole portfolio.
Run that for a few cycles and the baseline starts to talk. A component class corroding faster on one segment. A defect pattern that traces to one contractor's installation practice. Loading that shows up as accelerating wear on a known set of structures.
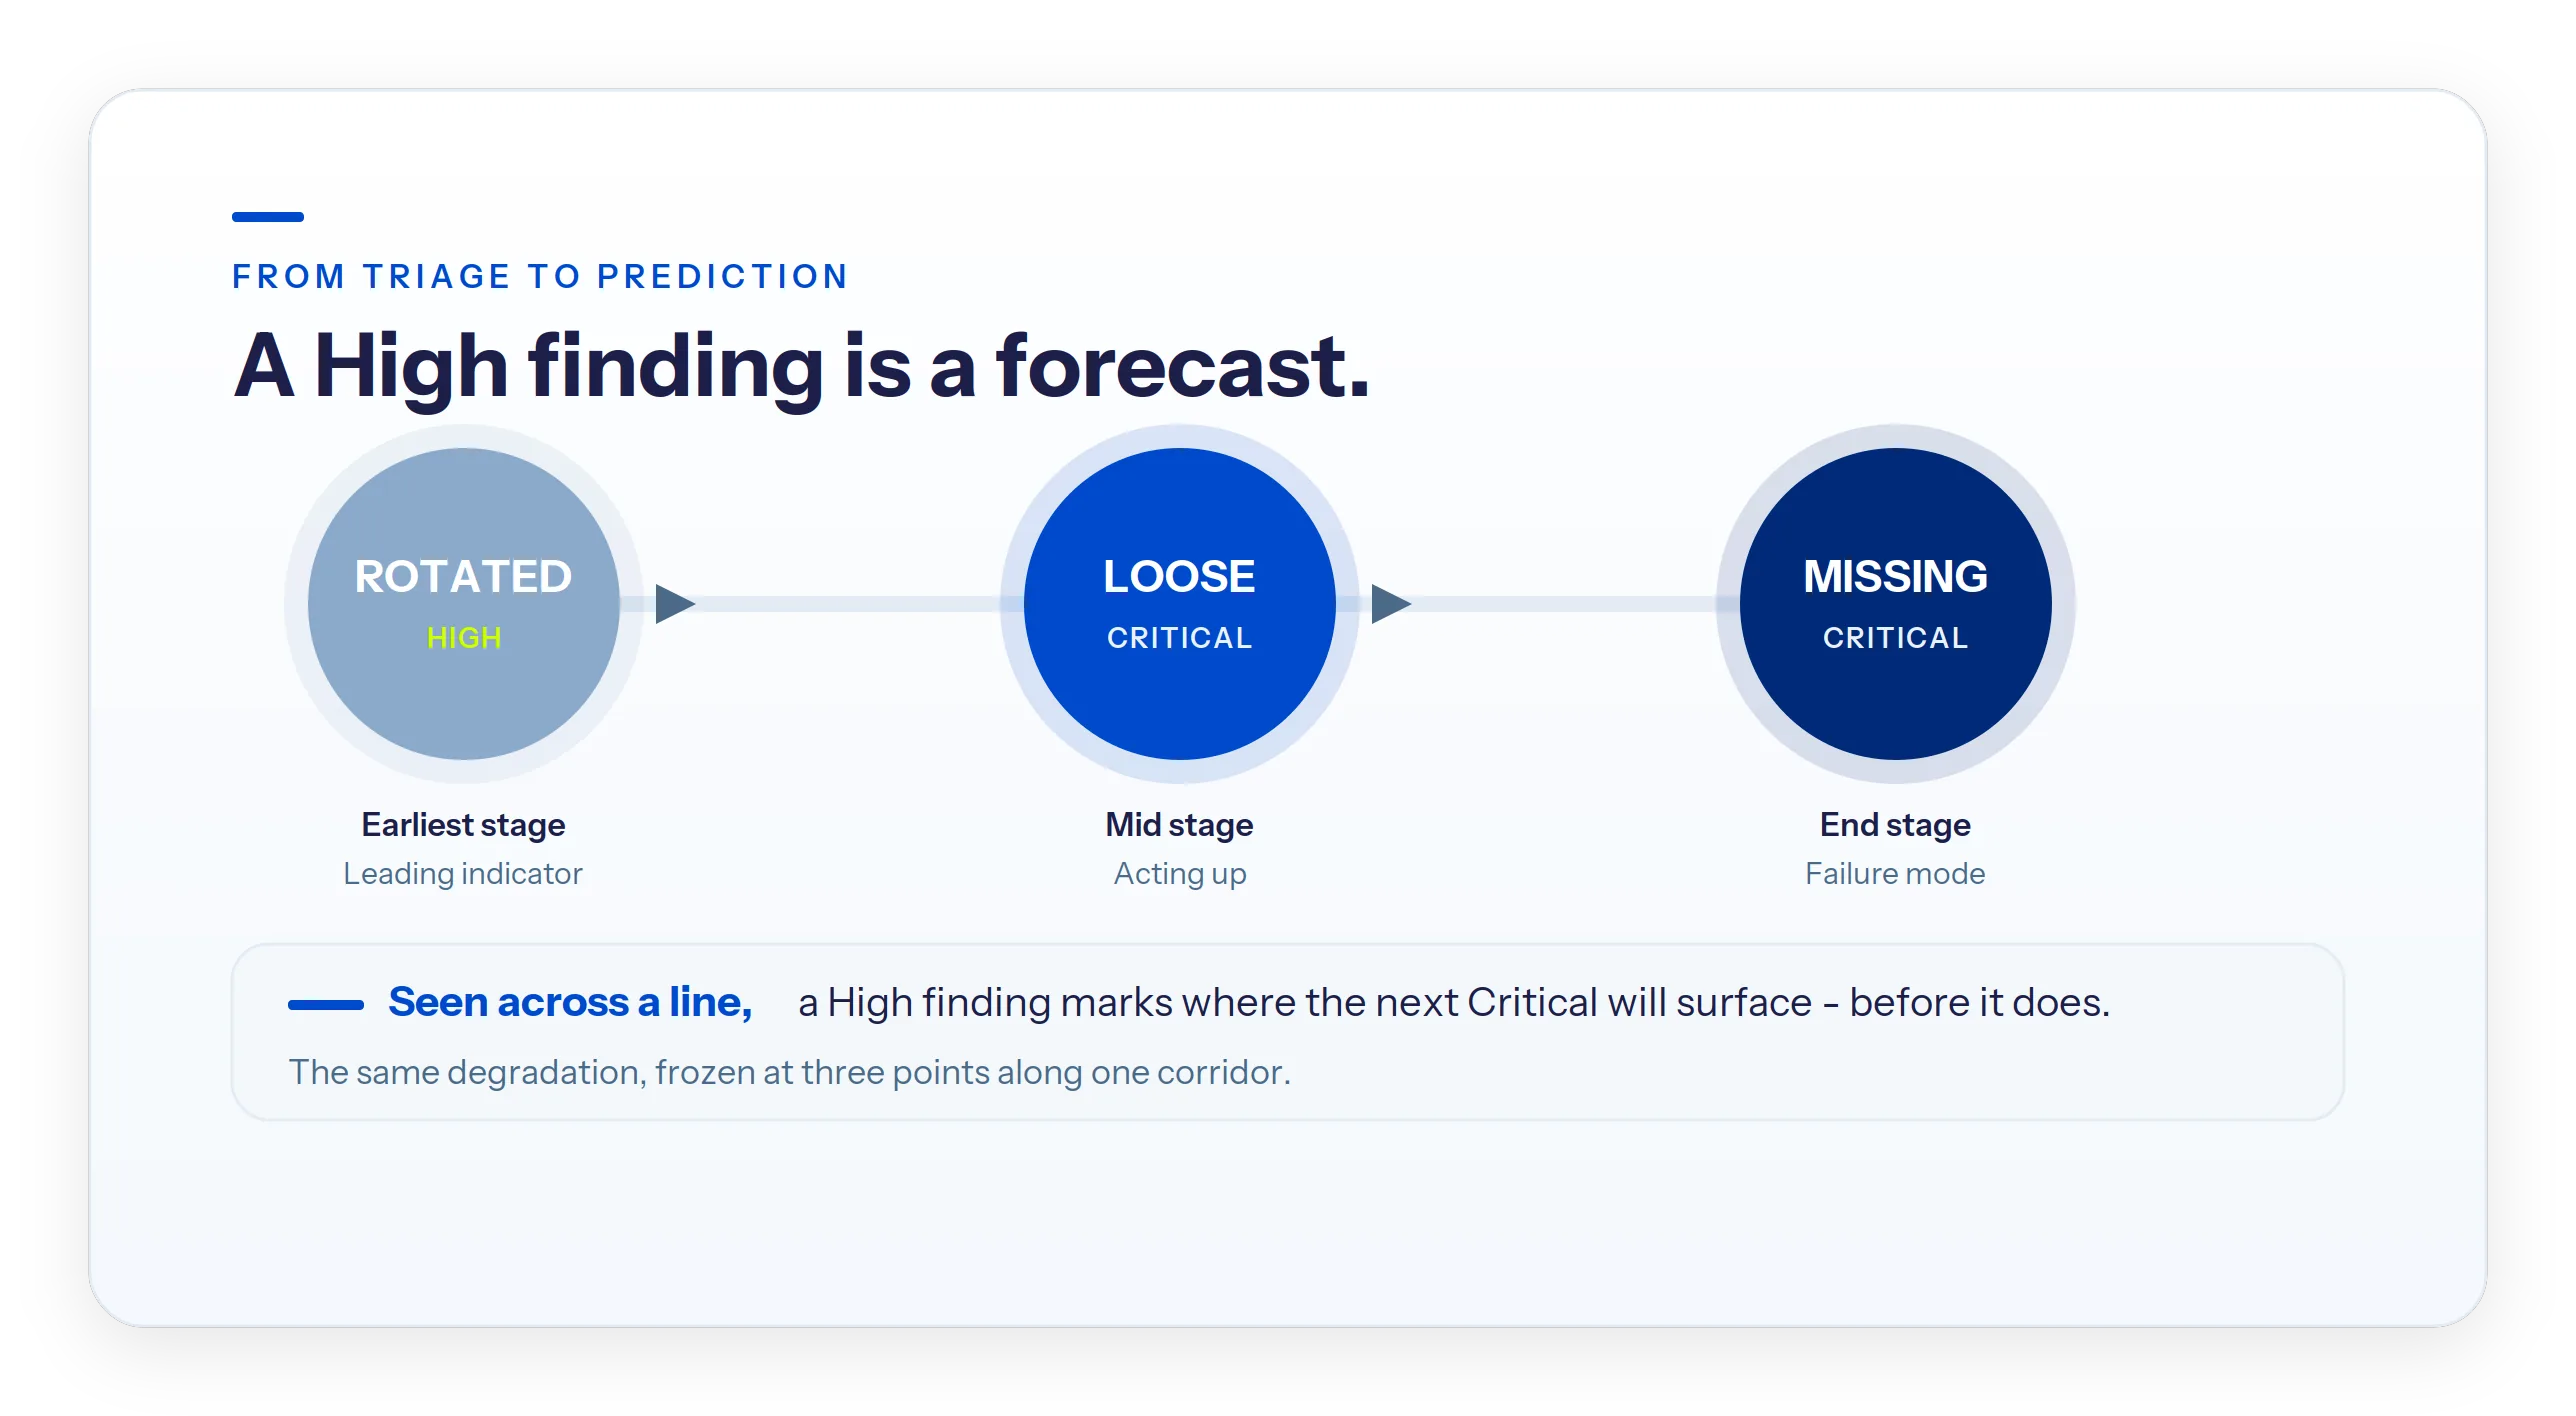
The most useful signal is the leading indicator. On one transmission line, a corona ring scored Rotated (High) is the first stage of the same failure that appears a few structures down as a Missing ring (Critical). Seen across the corridor, that High finding stops being a low-priority note and becomes a forecast: it marks where the next Critical will surface before it does. That is the difference between a list of today's defects and a model of tomorrow's failures.
From reactive to condition-based to predictive maintenance
That is the path most utilities are on: reactive inspection first, then condition-based maintenance, then prediction. The order is not optional. A predictive layer is only as good as the data underneath it, and that data is only as good as the day-one triage that produced it.
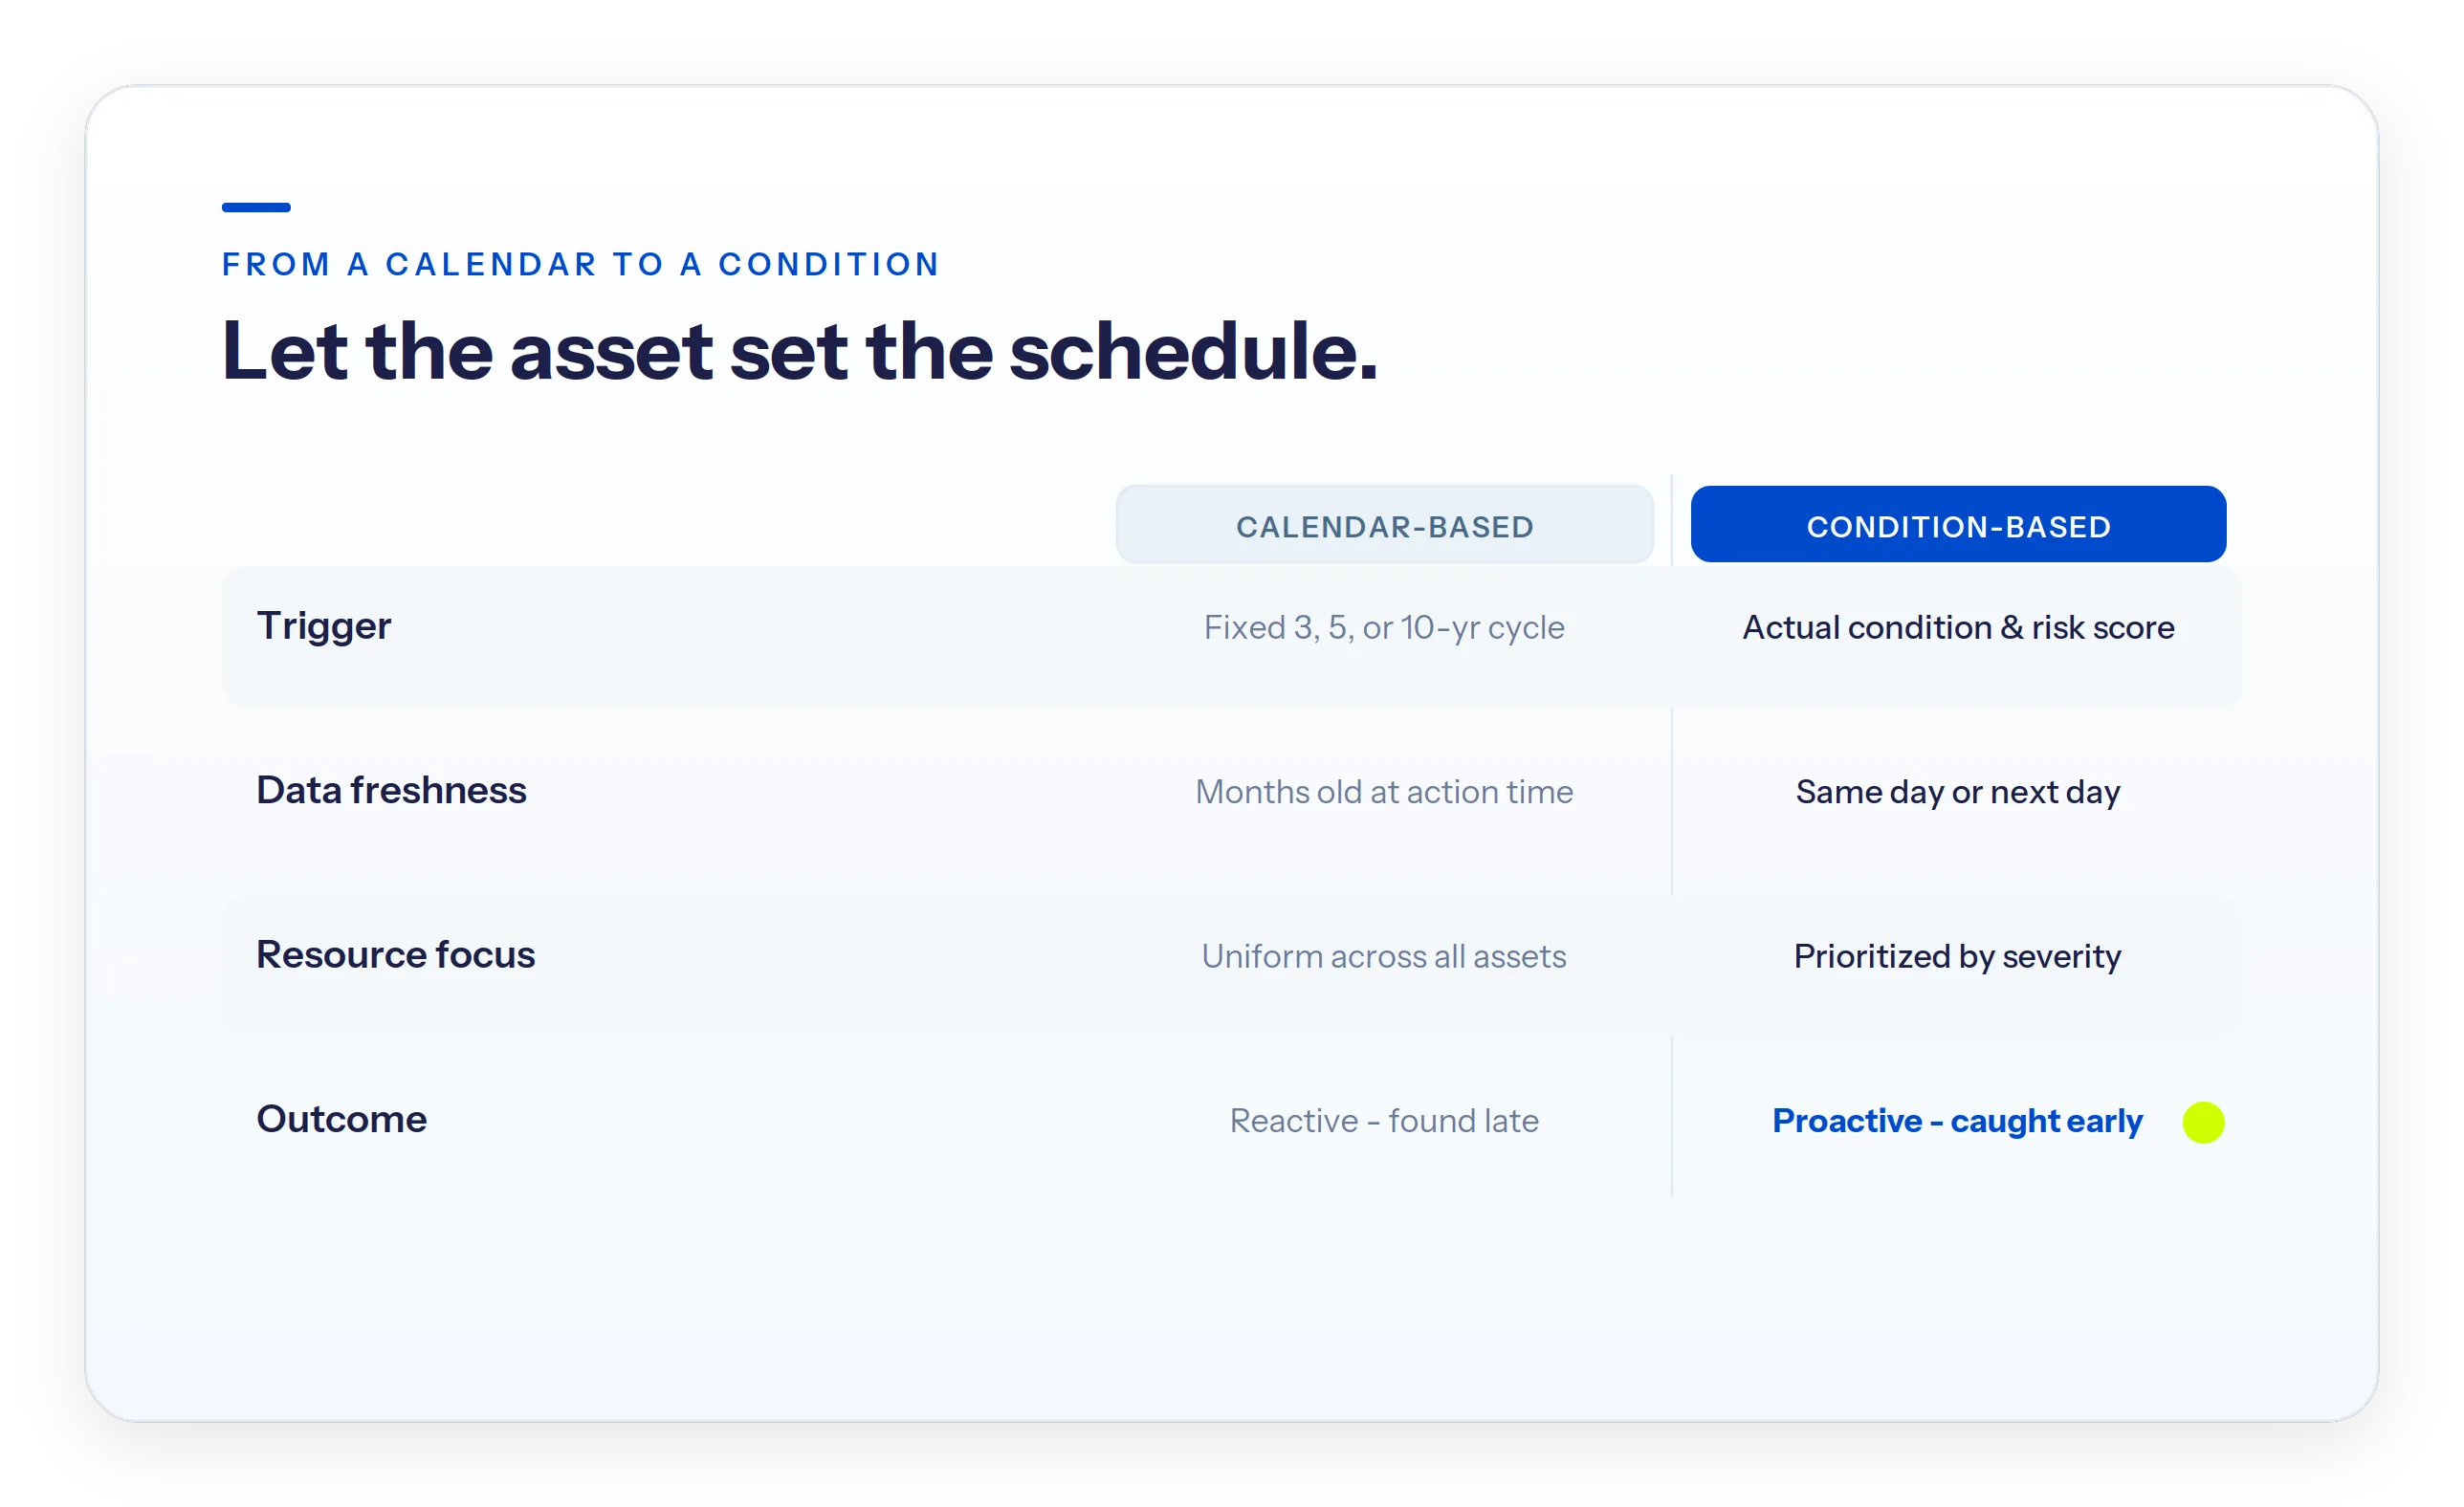
The practical shift this unlocks is from a calendar to a condition. Most inspection programs still run on a fixed cycle; same-day triage lets the asset's measured condition set the schedule instead.
| Calendar-based inspection | Condition-based inspection | |
|---|---|---|
| Trigger | Fixed schedule every 3, 5, or 10 years | Actual asset condition and risk score |
| Data freshness at action time | Months old | Same day or next day |
| Resource allocation | Uniform across all assets | Prioritized by severity |
| Outcome | Reactive, problems found late | Proactive, problems caught early |
How to evaluate an AI visual inspection platform
Most platforms in this category can find a defect in a clear image. The differences that decide a large program show up in the columns next to "detection." The table below maps the common approaches to inspection analysis.
How approaches to utility inspection analysis compare
| Approach | How it analyzes | Turnaround | Grades image quality | Prioritization | Works with any capture source |
|---|---|---|---|---|---|
| In-house or engineering manual review | Human analysts review images | Weeks to months | No, ad hoc | Experience-based | Any source |
| Capture-coupled AI (tied to one drone or camera system) | AI runs on the vendor's own capture | Hours to days | Usually not | Detection list | No, locked to that method |
| Software-only AI analytics | AI runs on uploaded imagery | Hours to days | Varies by vendor | Classified and prioritized | Yes, if quality standards are met |
| Quality-first, source-agnostic triage | Grades imagery, then AI and expert review in parallel | Same day | Yes, before analysis | Severity times criticality, ranked into tiers | Yes, any sensor or vendor |
If you are evaluating an AI visual asset inspection platform for utilities, these are the questions worth asking. The criteria utilities weight most heavily in 2026 are detailed in our State of Utility Drone Inspections report .
Does the platform grade capture quality before analysis?
A platform that reports findings without telling you how much of the asset was actually assessable is reporting confidence it has not earned.
Does it rank defects by consequence, not just detect them?
Detection produces a list. Ranking by severity and component criticality produces a work plan. For a large utility asset management program, the work plan is the one that survives contact with a crew schedule.
Does it work with your existing capture methods?
Some platforms are tied to a single capture method: one drone, one camera, one vehicle. Grid programs are mixed by nature. Drone, helicopter, truck, and smartphone. Your crews and your contractors. A platform that is sensor- and vendor-agnostic analyzes all of it on the same scale, so a finding means the same thing no matter who captured it.
Is it audit-ready for regulators and your board?
Reliability data ends up in front of regulators, underwriters, and your board. Findings should map to your defect taxonomy and carry the image and location, so the record defends itself.
Does it hold quality across crews and geographies?
A platform that performs on a 50-structure pilot and drifts on a 50,000-structure rollout has not solved the problem large utilities actually have. Consistency across the portfolio is the test.
Does it connect to your GIS, CMMS, and work-order systems?
Findings that flow into your GIS, CMMS, and work-order systems on the first pass turn analysis into action. Findings that need manual re-entry add a step you pay for every cycle.
The same day the drone lands
Inspection is becoming a commodity. Anyone can fly a corridor and hand you images. The value is not in the pictures. It is in turning them into decisions you can trust, fast enough to act while the condition still matches.
That is what same-day AI triage does. It ranks the defect before a human opens the file. It grades the imagery before it trusts the model. It puts a repair-versus-failure number on the findings that matter. For an asset manager, that is the difference between knowing your grid is aging and knowing exactly where to send the next crew.
Detect turns inspection data into decisions you can act on, and defend, the same day the drone lands.
Frequently asked questions
What is an AI visual asset inspection platform for utilities?
It is a platform that analyzes inspection imagery - from drones, helicopters, vehicles, or handheld cameras - using computer vision and expert review to detect, classify, and prioritize defects on grid assets. The strongest platforms grade image quality before analysis and rank findings by risk the same day they are captured.
How does an AI visual inspection platform improve grid reliability?
By compressing the time between capture and action. Same-day triage ranks defects by severity and component criticality the day images are taken, so crews fix the highest-risk components before they fail. That directly reduces the unplanned outages that push SAIDI and SAIFI higher.
What does "same-day AI analysis of utility images" mean?
Raw imagery is graded, analyzed, and sorted into priority tiers within the same day it is captured. Urgent risks are flagged in hours rather than held for a full report weeks later.
How is triage different from predictive maintenance for grid assets?
Triage tells you what to fix now. Predictive maintenance forecasts what will fail next. Triage comes first, because a trustworthy, image-linked, consistently scored baseline is what makes any predictive layer credible.
What should a large utility look for in an inspection platform?
Quality grading before analysis, ranking by consequence rather than raw detection, support for the capture methods you already use, audit-ready records tied to your taxonomy, and consistent performance across the full portfolio rather than a single pilot.
Does AI replace human inspectors?
No. In a same-day triage workflow, AI handles the volume by sorting tens of thousands of images and flagging candidates, while trained analysts validate the findings that carry consequences. AI is a force multiplier for expert teams, not a replacement.
Sources
- U.S. Energy Information Administration, Today in Energy - 2024 hours without power: https://www.eia.gov/todayinenergy/detail.php?id=66744
- U.S. Energy Information Administration, Electric Power Annual - 2022 distribution reliability (SAIDI).
- Oak Ridge National Laboratory - U.S. power outage cost analysis (2024-2025).
- IEEE 1366 - Guide for Electric Power Distribution Reliability Indices (SAIDI, SAIFI).
- U.S. Department of Energy-funded outage interruption-cost methodology.
- Duke Energy distribution pole-inspection figures (industry-reported).
- Detect program data: a new 345 kV transmission program, a 2,600-tower campaign, and Detect's transmission defect catalog.
Related reading: understand the ROI case for AI asset inspection and predictive grid intelligence from inspection imagery.
