
What Utilities Actually Evaluate When Choosing a Drone Inspection Vendor
Most DSPs think they lost the contract on price. They didn't.
You submitted a competitive bid. Your pilots have the hours. Your equipment is current. And the utility went with someone else.
Most DSPs assume they lost on price. In our experience, that's almost never what happened. The decision was usually made before anyone compared pricing lines, because the vendor that won cleared hurdles the others didn't even know existed.
Detect works with utilities on both sides of this transaction. We process the inspection data that DSPs capture, and we see the evaluation criteria that utilities use to select who captures it. That vantage point is rare in this industry, and it gives us a clear view of what actually separates the vendor who wins the contract from the four who don't.
Here's the real utility drone vendor evaluation criteria in the order utilities actually weight them, with the data behind each one and specific guidance on how to win utility drone contracts.
In this article
- Why the stakes are so high right now
- The evaluation hierarchy most DSPs get wrong
- The two gates you must pass before anything else
- The six criteria that actually decide the winner
- A self-assessment scorecard for your operation
- What to do with this information
Why utility inspection spending is at an all-time high
Before we get into evaluation criteria, it helps to understand the environment utilities are operating in right now, because it directly shapes what they demand from drone inspection vendors.
$1.1 trillion in grid investment over 5 years
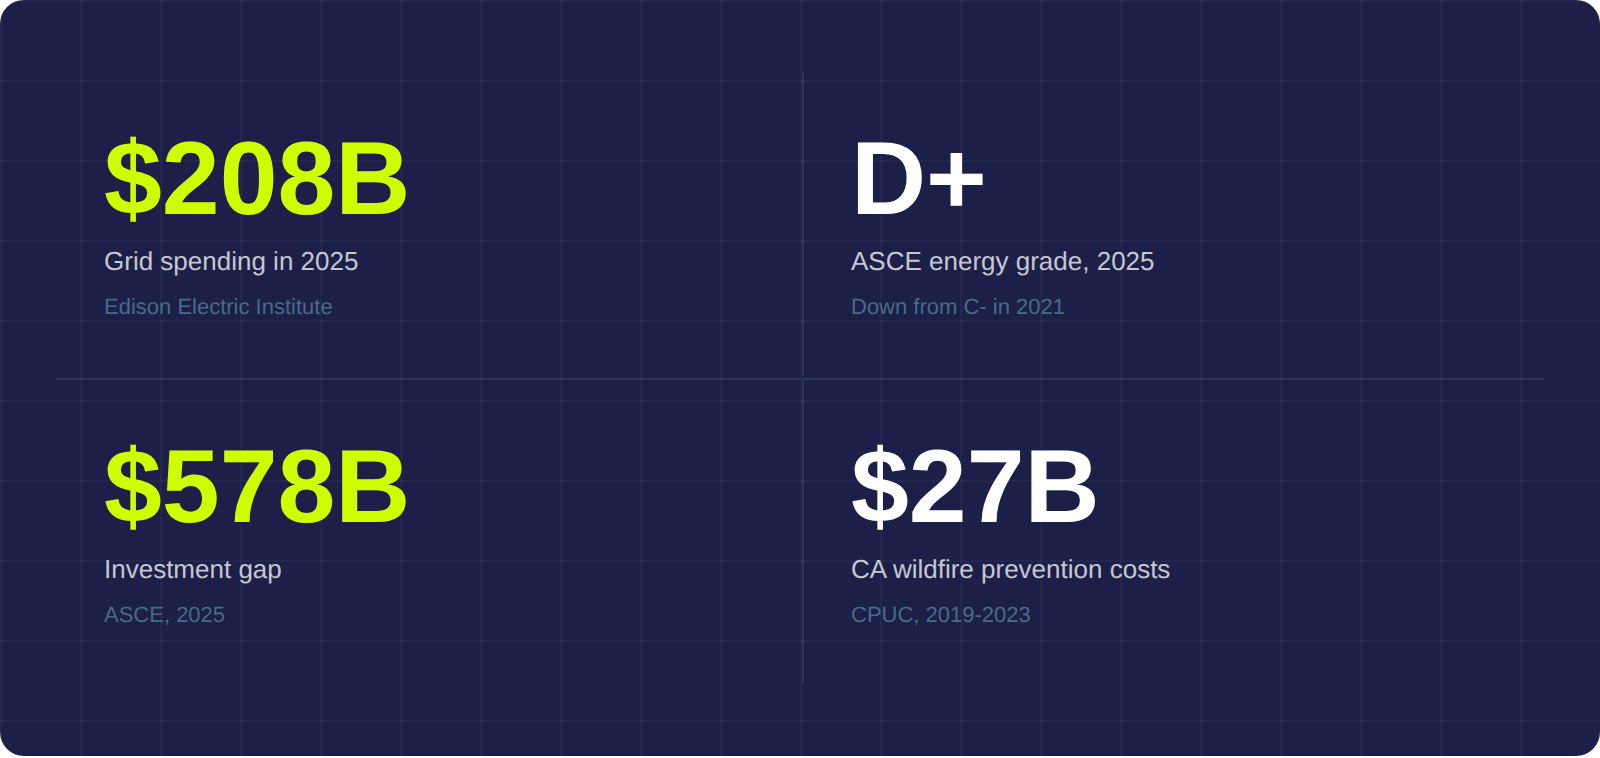
Investor-owned utilities will spend nearly $208 billion on grid upgrades in 2025, and more than $1.1 trillion over the next five years. That spending is driven by aging infrastructure, surging electricity demand from data centers and electrification, and a grid that the American Society of Civil Engineers downgraded to a D+ in 2025 - down from C- just four years earlier.
The cost of getting inspection wrong
The investment gap between what's planned and what the grid actually needs stands at $578 billion. The consequences of underinvestment aren't theoretical. California's three largest utilities collected $27 billion in wildfire prevention and insurance costs from ratepayers between 2019 and 2023. The Pacific Palisades fires in January 2025 caused an estimated $50 billion in economic damage.
What this means for drone inspection vendor selection
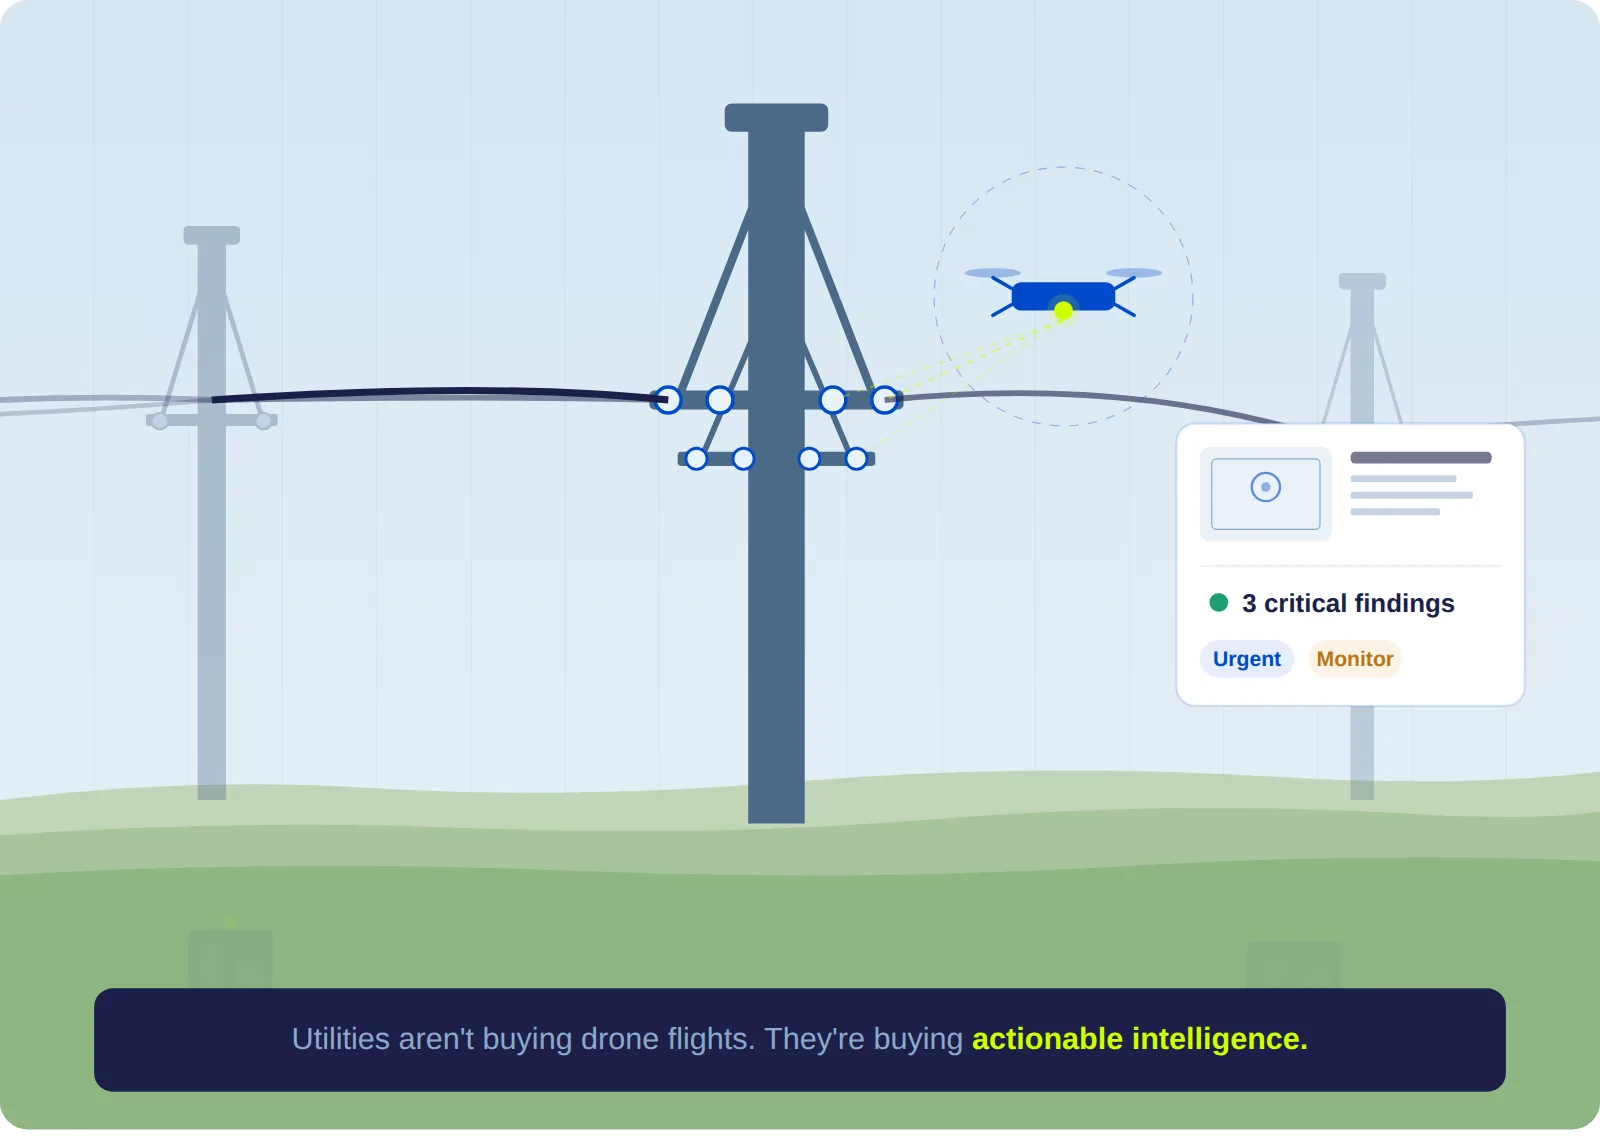
Every inspection dollar has to produce intelligence that someone can act on. A utility can't pay for imagery that sits in a queue for three months. They can't pay for reflights on data that should have been right the first time, or for a report that arrives after the failure it was supposed to prevent.
That pressure is accelerating, and it shows up directly in how aggressively utilities evaluate the vendors competing for their inspection contracts.
How utilities rank drone vendor evaluation criteria
Ask most drone service providers what utilities care about when selecting a vendor, and they'll list their own strengths: flight hours, camera resolution, years in business, price per mile. Those factors show up in evaluations, but they rarely decide the outcome.
Here's what the evaluation structure actually looks like, based on what we see across utility procurement processes:
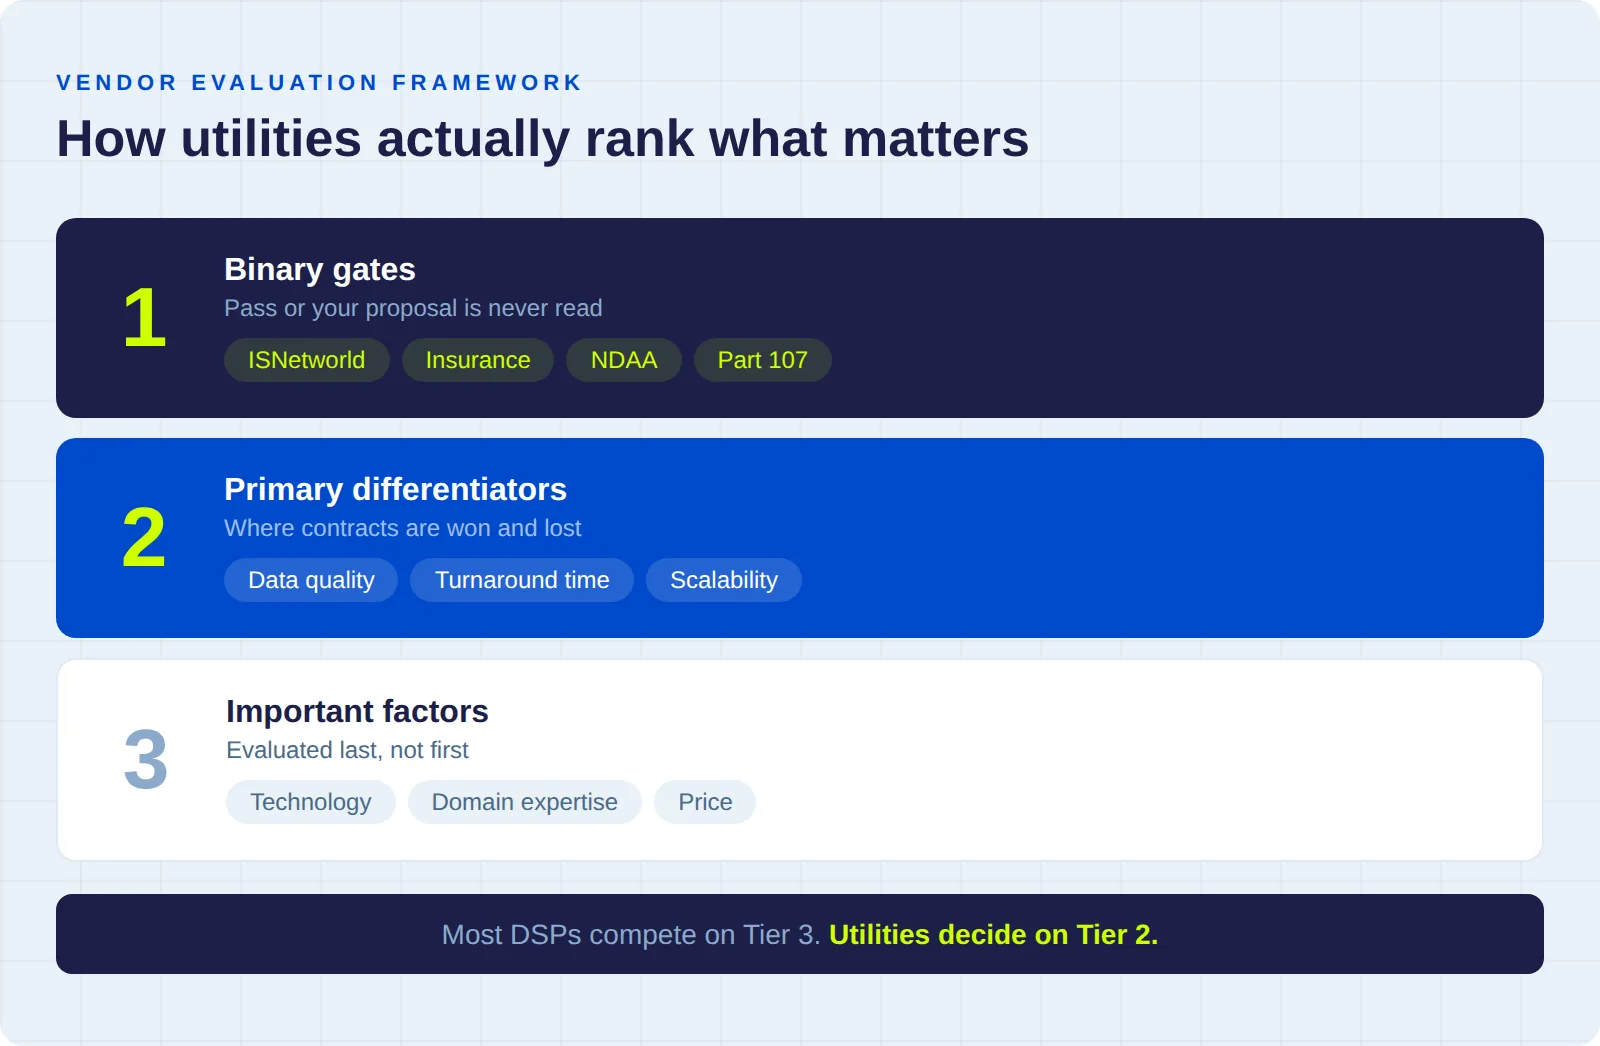
Tier 1: Binary gates (pass or fail)
Safety prequalification (ISNetworld, Avetta), insurance thresholds, regulatory compliance (Part 107, NDAA), and cybersecurity. If you fail any of these, your proposal never gets read. These aren't weighted. They're yes/no.
Roughly half of DSP proposals we've seen get filtered out at this stage, and most of those vendors never find out why.
Tier 2: Primary differentiators (highest weight in scoring)
Data quality and delivery capability, turnaround time, and scalability. This is where contracts are actually decided. The gap between winning and losing vendors is widest on these three criteria.
Tier 3: Important factors (moderate weight)
Technology and analytics capability, domain expertise, and price. They matter, but they're evaluated after the first two tiers have already narrowed the field.
The vendor that spends all their proposal energy on price competitiveness while neglecting their ISNetworld rating and rework metrics is optimizing for the wrong stage of the evaluation. The trends reshaping this market in 2026 - in-house utility programs, BVLOS regulation, the DJI fleet transition - are all reinforcing this hierarchy.
Gate 1: ISNetworld and safety prequalification
This is where the majority of unsuccessful bids actually fail, and most vendors don't realize it because they never receive feedback at this stage. The utility's procurement team reviews safety prequalification status before anyone in the inspection department sees your proposal.
The industry standard is ISNetworld, which connects over 850 hiring clients with 85,000+ active contractors.
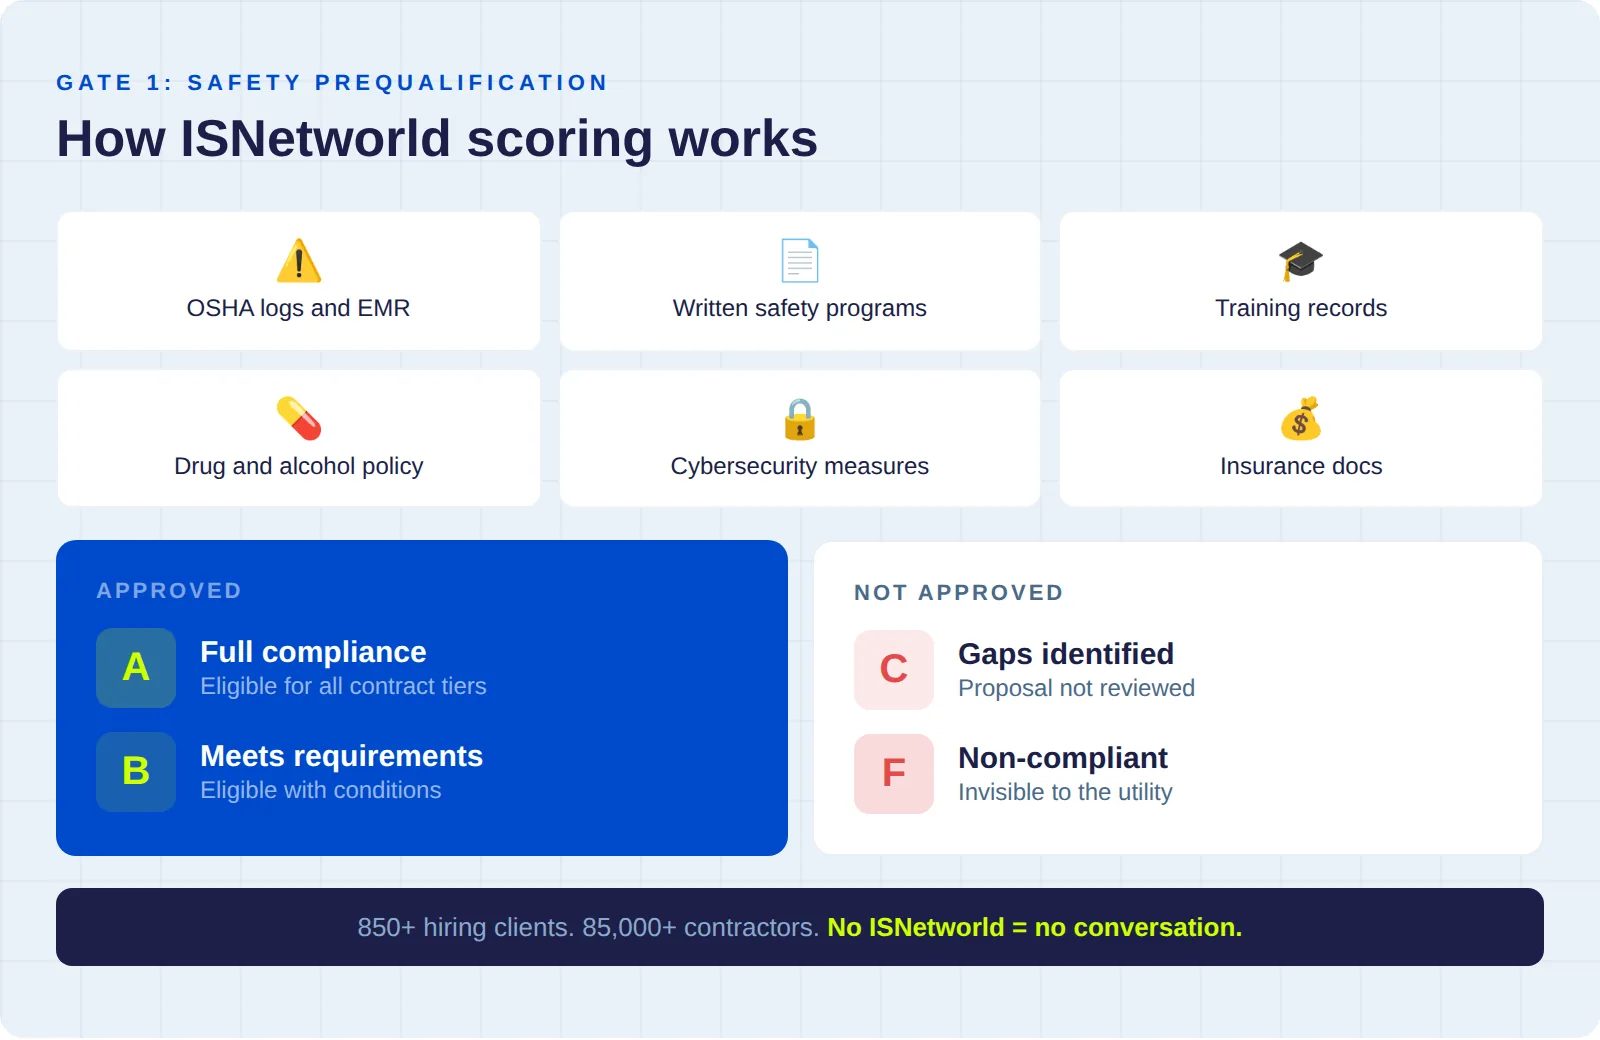
What ISNetworld evaluates
- OSHA records - 300/301 logs, citation history, fatality and injury rates
- EMR - Experience Modification Rate
- Written programs - health, safety, and environmental programs
- Policies - drug and alcohol, incident reporting
- Training documentation - employee records, site-specific orientation
- Cybersecurity measures - increasingly required for critical infrastructure work
How utilities grade contractors
PG&E's process illustrates the standard approach. Contractors are assessed against their industry classification and assigned a grade:
- A or B - Approved. Your proposal advances to technical evaluation.
- C or F - Not approved. Your proposal doesn't advance, regardless of pricing or track record.
Alliant Energy and Enbridge use the same framework. Grades are verified annually.
ISNetworld compliance isn't something you can rush through the week you find a contract you want to bid on. Preparing your safety manual, compiling training records, and getting through the RAVS review process takes weeks. The DSPs that win utility contracts treat ISNetworld as standing infrastructure for their business.
Gate 2: Insurance, NDAA compliance, and regulatory readiness
Even with ISNetworld cleared, utilities apply a second compliance filter. These requirements are deliberately set high enough to narrow the field to operators who take critical infrastructure work seriously.
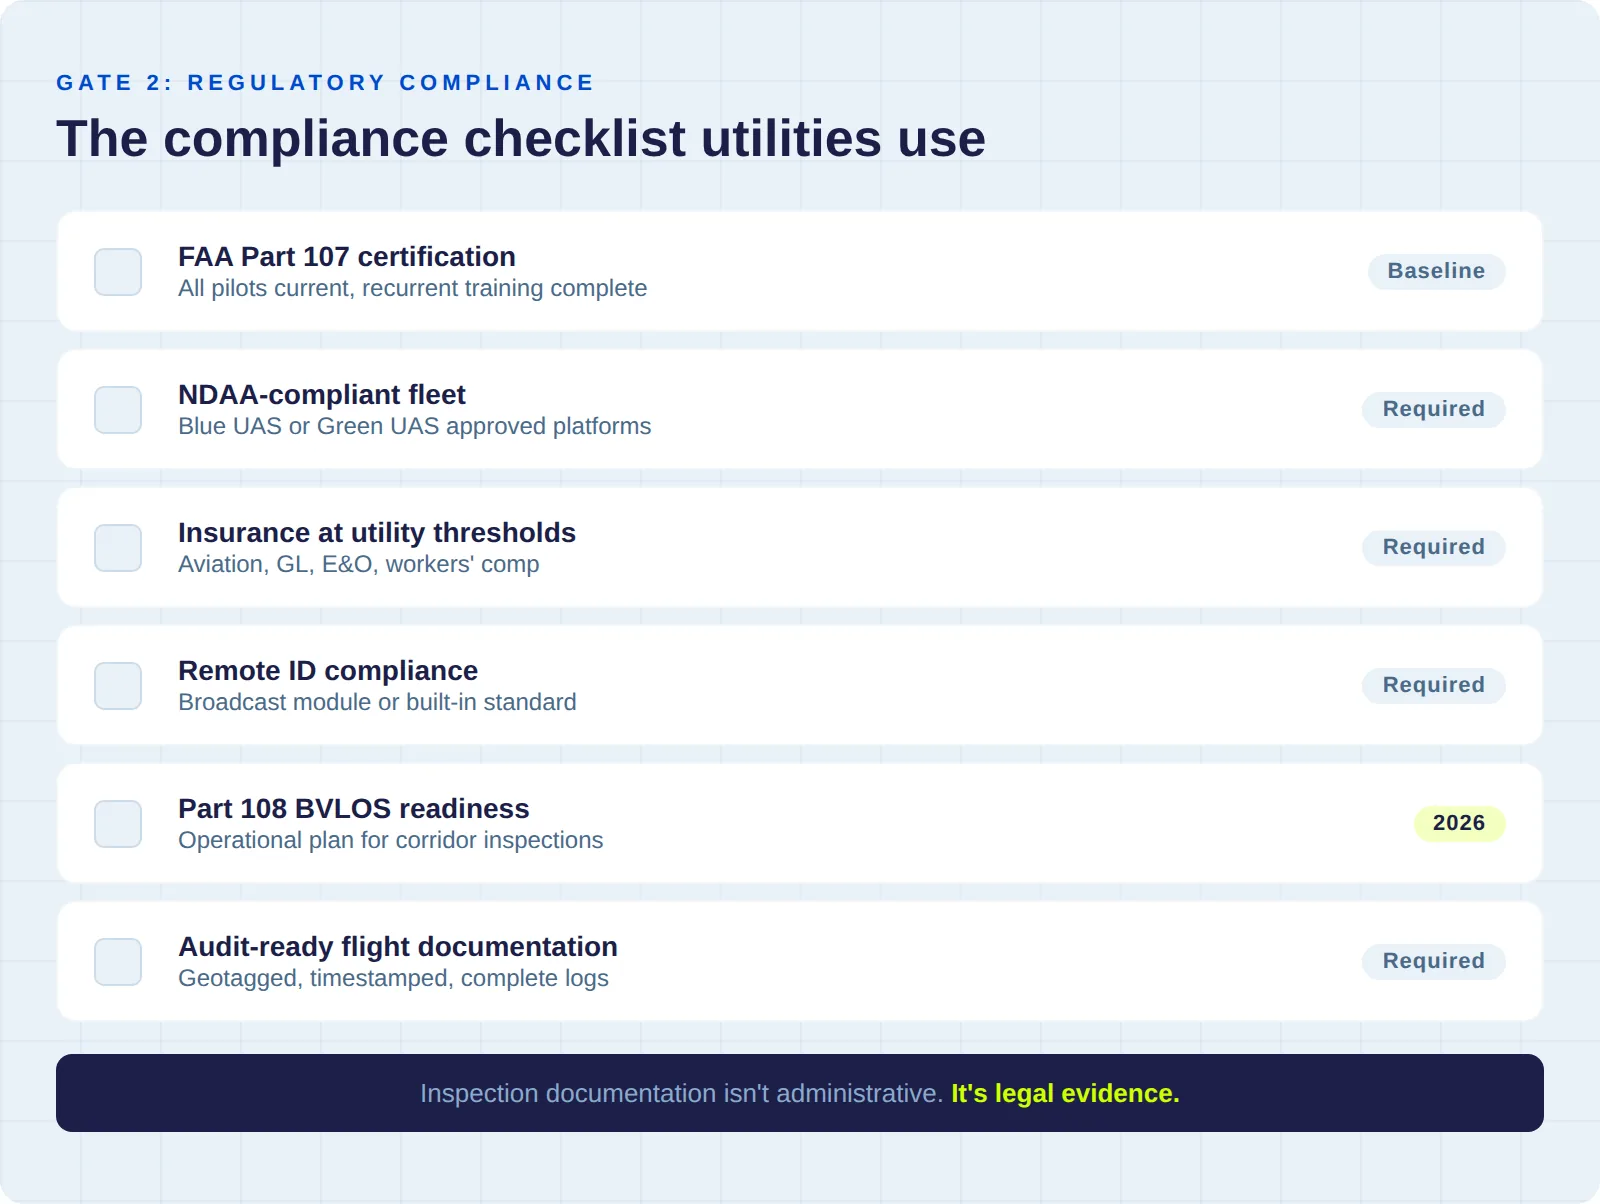
Insurance thresholds for utility drone inspection contracts
Utilities typically require coverage well beyond standard Part 107 minimums:
- General liability at utility-specified thresholds
- Professional liability / errors and omissions
- Aviation-specific hull and liability coverage
- Workers' compensation
A drone incident near energized lines or inside a substation creates real liability exposure for the utility, and they need to know their vendor can absorb it.
NDAA-compliant drone fleet requirements
NDAA compliance has moved from a federal procurement requirement to a utility procurement expectation. If your fleet includes DJI platforms that aren't on the Blue UAS or Green UAS approved lists, many utilities will flag that as a compliance risk. Our NDAA compliance guide walks through the current state of fleet transition for DSPs.
FAA Part 108 BVLOS readiness
The August 2025 BVLOS rulemaking creates a standardized pathway for routine corridor inspections without per-mission waivers. Utilities are already evaluating which vendors have an operational plan for BVLOS, because it directly affects how efficiently long transmission corridors can be inspected.
Audit-ready flight documentation
Geotagged, timestamped imagery with complete flight logs and chain-of-custody records. In a regulatory environment where utilities face wildfire liability exposure measured in billions of dollars, inspection documentation has become legal evidence.
Criterion 1: Drone inspection data quality
Once you've cleared the gates, this is the criterion that carries the most weight in utility drone vendor evaluation, and the one where the gap between winning and losing vendors is widest.
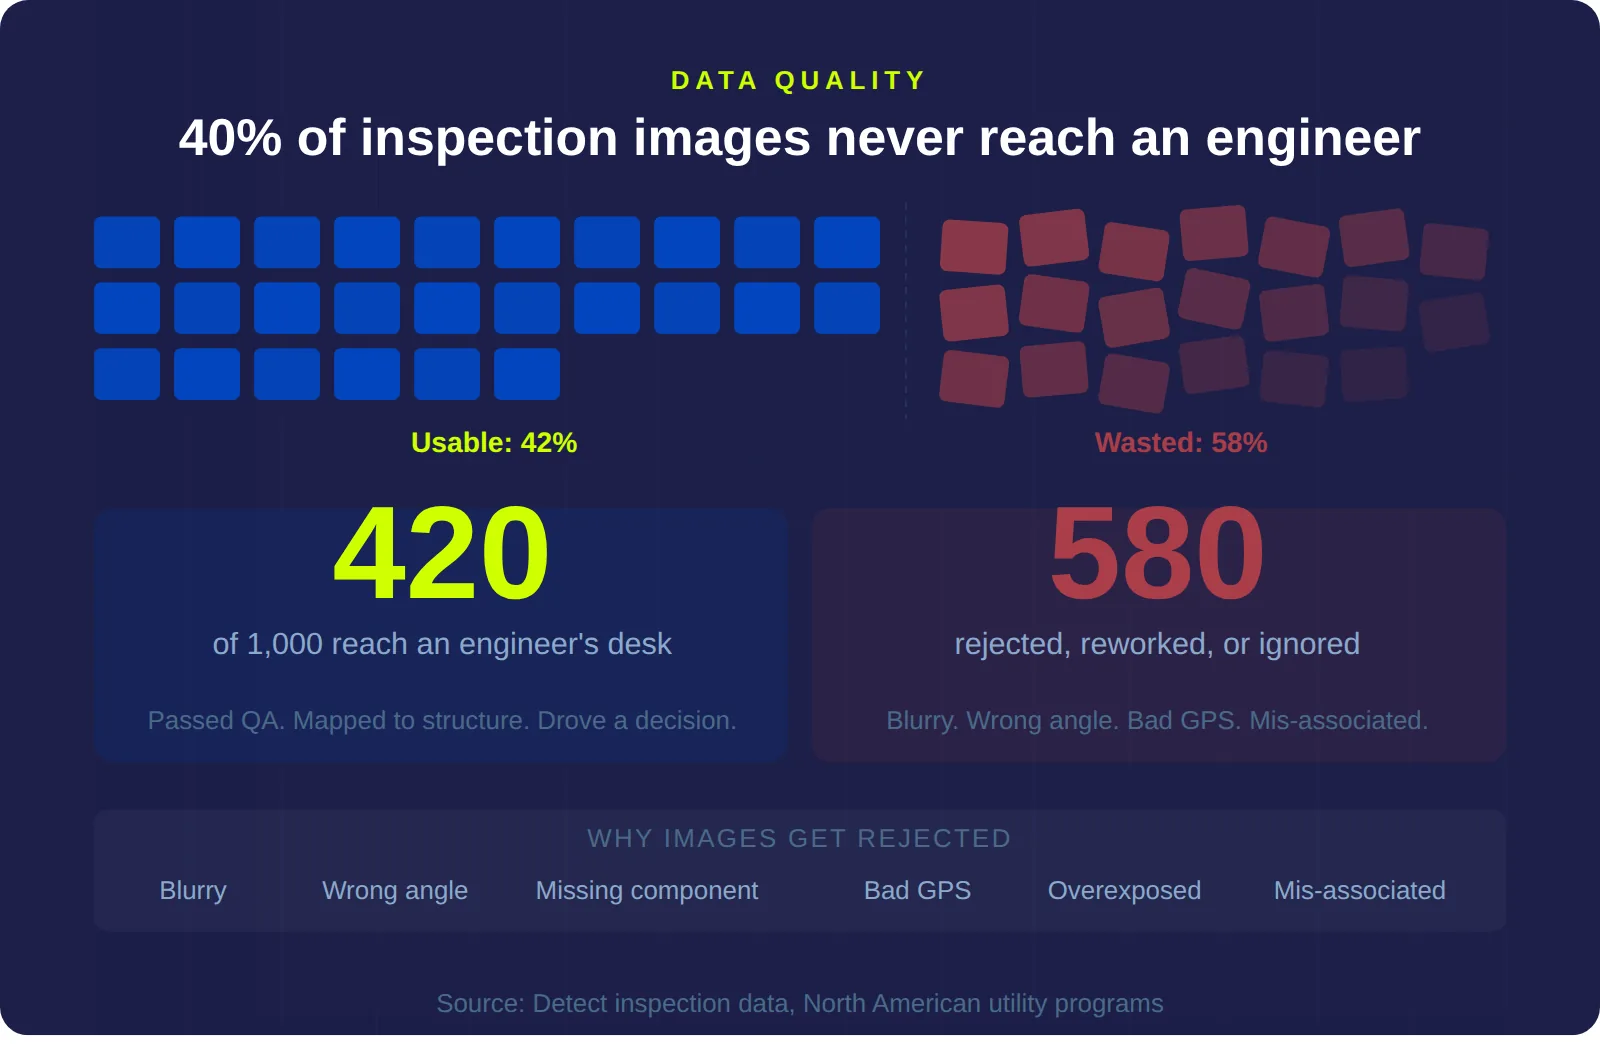
The 40% rejection rate problem
Approximately 40% of drone inspection images delivered to utilities get rejected for capture problems before they ever reach an engineer's desk. That number comes from Detect's direct experience processing inspection data across North American utilities. It's consistent enough across programs that we've stopped treating it as an outlier.
The root causes are well-documented: wrong angles, insufficient resolution, missing components, GPS errors, and images that can't be reliably associated with the correct structure.
What utilities actually assess in inspection data quality
Completeness of coverage
Every insulator, every conductor attachment, every bolted connection on every structure needs to be captured at a resolution that allows an engineer to assess condition and make a maintenance decision. Knowing the difference between a lattice tower, a monopole, and an H-frame and understanding what each structure type requires in terms of angle coverage and component focus is what separates inspection data from aerial photography.
Consistency across your pilot roster
A utility isn't hiring your best pilot. They're hiring your operation. If pilot A delivers utility-grade imagery and pilot B delivers data that requires rework, the utility's effective experience is the average of those two. The workflow that eliminates this variability is one that standardizes capture methodology independently of individual pilot skill.
Rework rate as a measurable metric
On fixed-fee contracts, every rejected image set means a reflight at your cost. For the utility, it means their engineering team is waiting on data they need to prioritize capital improvements. If you can't tell a utility your rework rate as a percentage, they'll assume the worst, because the vendors who track it and have driven it below 10% will tell them theirs.
The Georgia Power benchmark for drone inspection programs
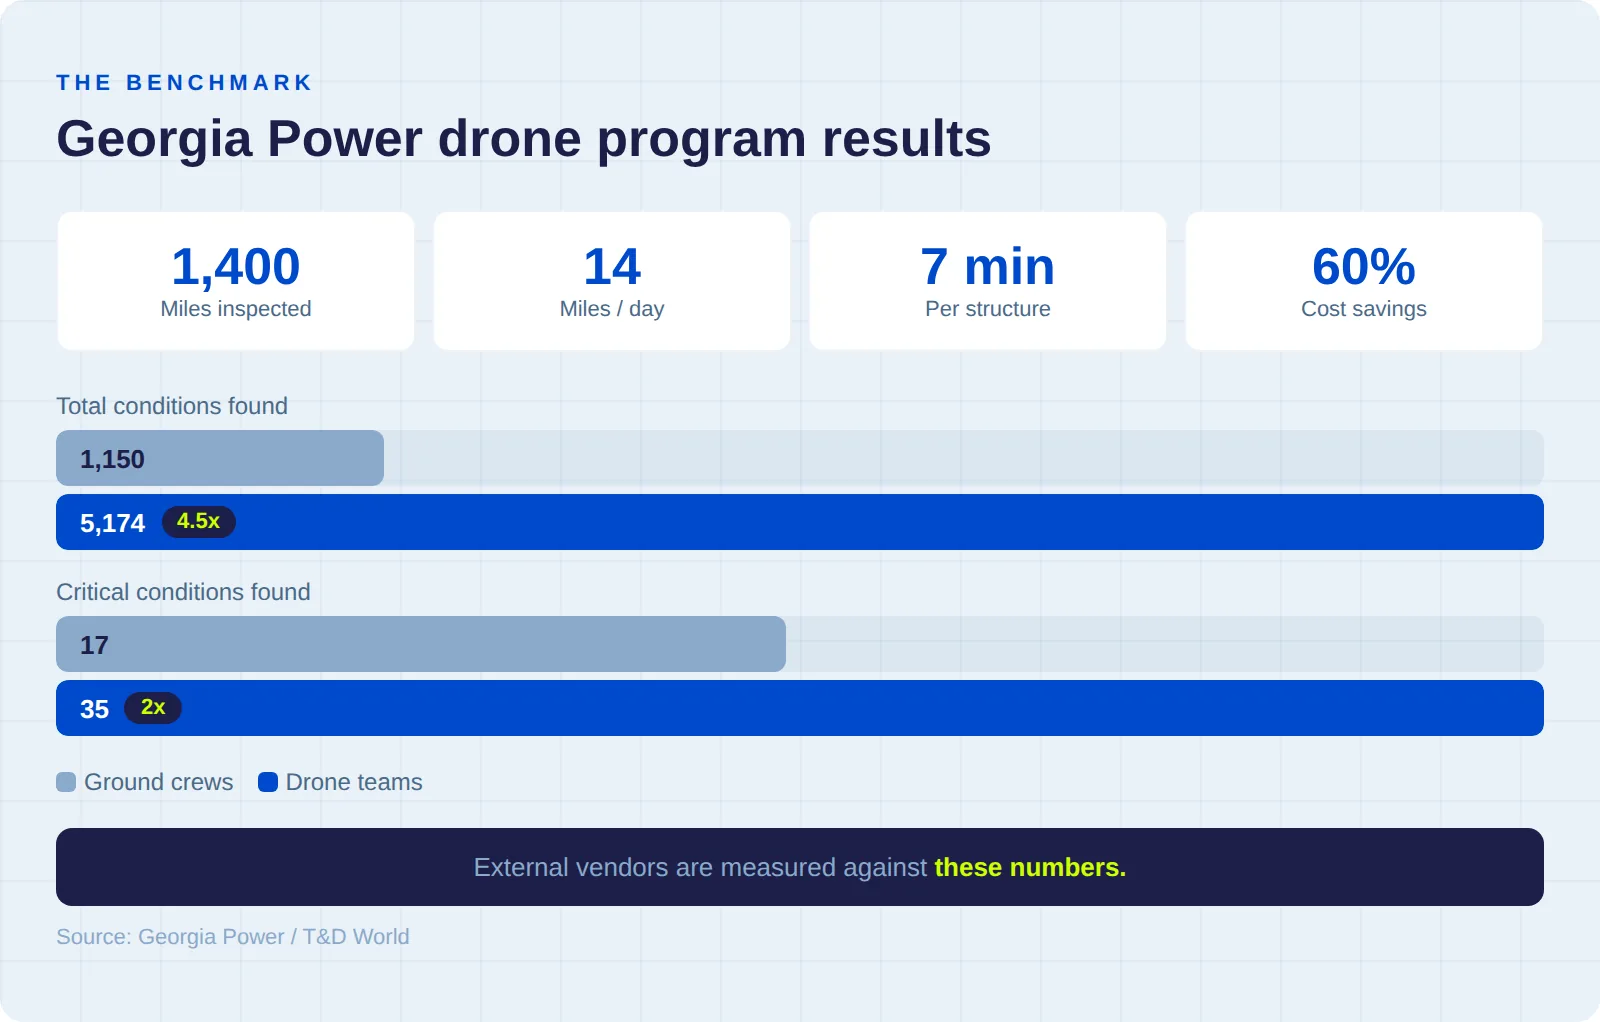
The benchmark that external vendors are measured against comes from Georgia Power's in-house program:
- 14 miles of inspections per day, with each structure taking about 7 minutes to fully inspect
- 5,174 abnormal conditions found by drones, versus 1,150 from ground crews (4.5x more defects)
- 35 critical conditions identified, versus 17 from traditional methods (2x more critical findings)
- 60% annual cost savings reported by Georgia Power with better data quality than traditional methods
If you're bidding for utility drone inspection contracts, your proposal is being evaluated alongside these numbers.
Criterion 2: Inspection turnaround time and data delivery
Most DSPs think of turnaround as "how fast can we fly the corridor." Utilities think of it as "how quickly does usable intelligence reach my engineering team." Those are very different questions.
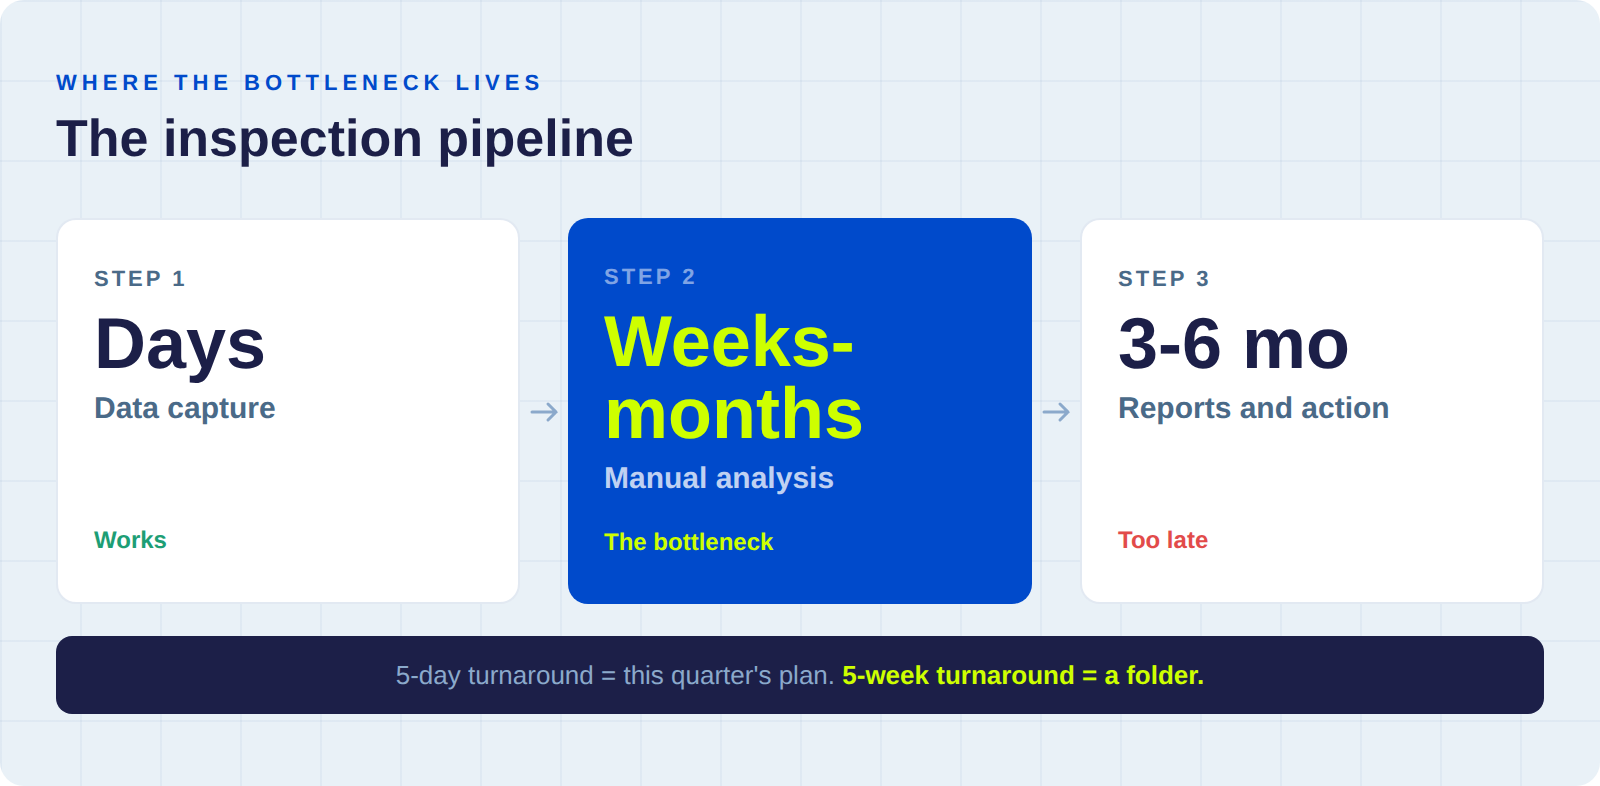
Where the drone inspection pipeline breaks down
Drone capture is the well-understood part of the pipeline - a three-person crew can cover 14 miles a day. The harder part is everything that happens after the drone lands.
A single transmission structure generates 15 to 30 high-resolution images from a typical drone flight. A 200-mile corridor produces tens of thousands of files. Each one needs to be:
- Mapped to the correct structure
- Validated for capture quality
- Screened for defects
- Classified by severity
- Formatted into a report that feeds the utility's asset management system
When this happens manually - and at most utilities, it still does - even a modest corridor inspection generates weeks or months of back-office processing. The engineers doing that review are the same engineers who should be making reliability decisions, designing maintenance strategies, and managing capital programs.
What utilities look for in data delivery speed
Utilities score turnaround time on several dimensions:
- How quickly imagery is processed and delivered after capture
- Whether defect findings are severity-ranked and actionable
- Whether reports integrate directly with their asset management or GIS platforms
- Whether deliverables are per-structure reports with annotated imagery, not bulk image dumps
A vendor who delivers complete, severity-ranked findings within five business days of capture is operating in a different category from one who delivers a raw image folder in two weeks and a written report in six to eight weeks. The five-day version drives this quarter's maintenance plan. The five-week version drives nothing.
Criterion 3: Scalability for utility-scale drone inspection
There's a version of this problem that's easy to miss until it's too late: the DSP that wins a 500-structure contract based on a strong 50-structure pilot project, then can't maintain quality at ten times the volume.
Georgia Power operates almost 12,000 miles of transmission lines and inspects more than 15,000 structures per year with 160+ in-house pilots and 200+ aircraft. You don't need to match that scale, but the utility evaluating your proposal is thinking about what happens when the scope grows.
Three scalability factors utilities evaluate
Crew depth and geographic coverage
Utility transmission corridors span hundreds of miles across varied terrain. If a utility needs simultaneous crews in three regions and your entire operation depends on two pilots, that's a single point of failure they'll factor into scoring.
Platform redundancy during fleet transitions
Equipment fails. Batteries degrade. In the middle of the DJI-to-NDAA fleet transition, supply chain complications can ground a platform unexpectedly. Utilities want to know you have backup capacity and that switching aircraft doesn't change the quality of the deliverable.
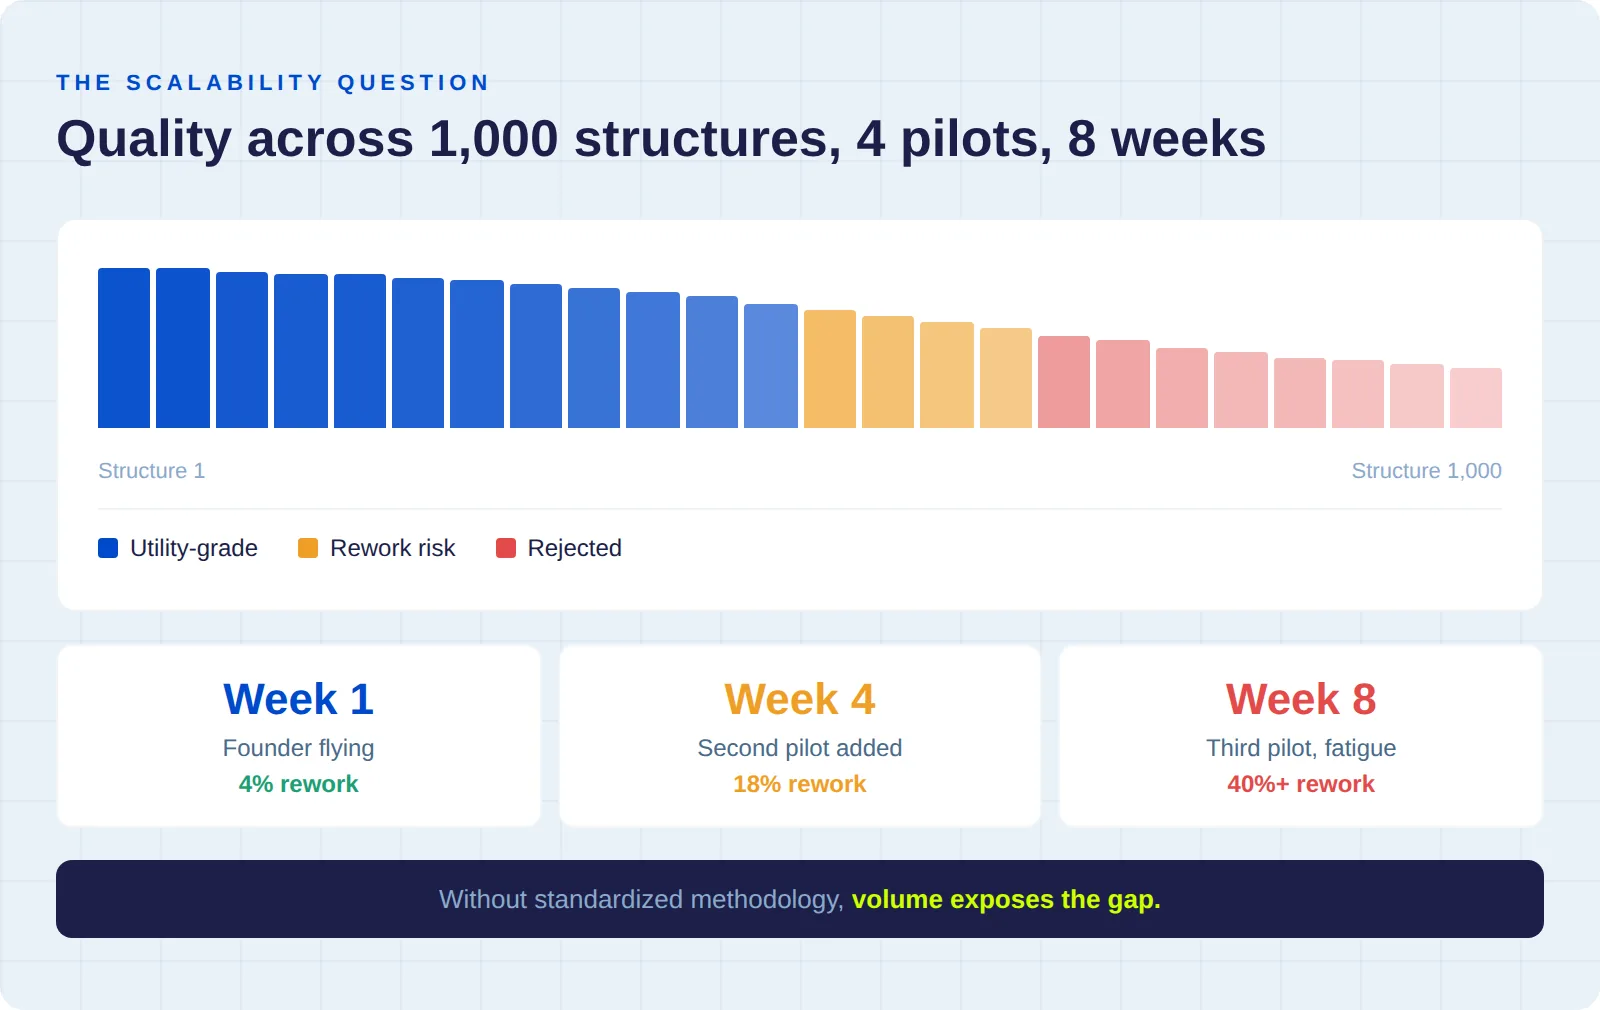
Quality consistency at volume
This is the hardest factor to show and the easiest one to fail on. A DSP can deliver utility-grade imagery on a 50-structure demo project where the founder is flying every mission personally. The question the utility is really asking is whether structure number 900 looks the same as structure number 9. If you don't have a standardized methodology that produces consistent results regardless of which pilot is flying, volume will expose that gap.
Criterion 4: Drone inspection technology and AI analytics
Utilities used to hire drone vendors to deliver imagery. The expectation now is that you deliver intelligence - findings that are classified, prioritized, and ready for integration with the utility's existing systems.
AI-assisted defect detection
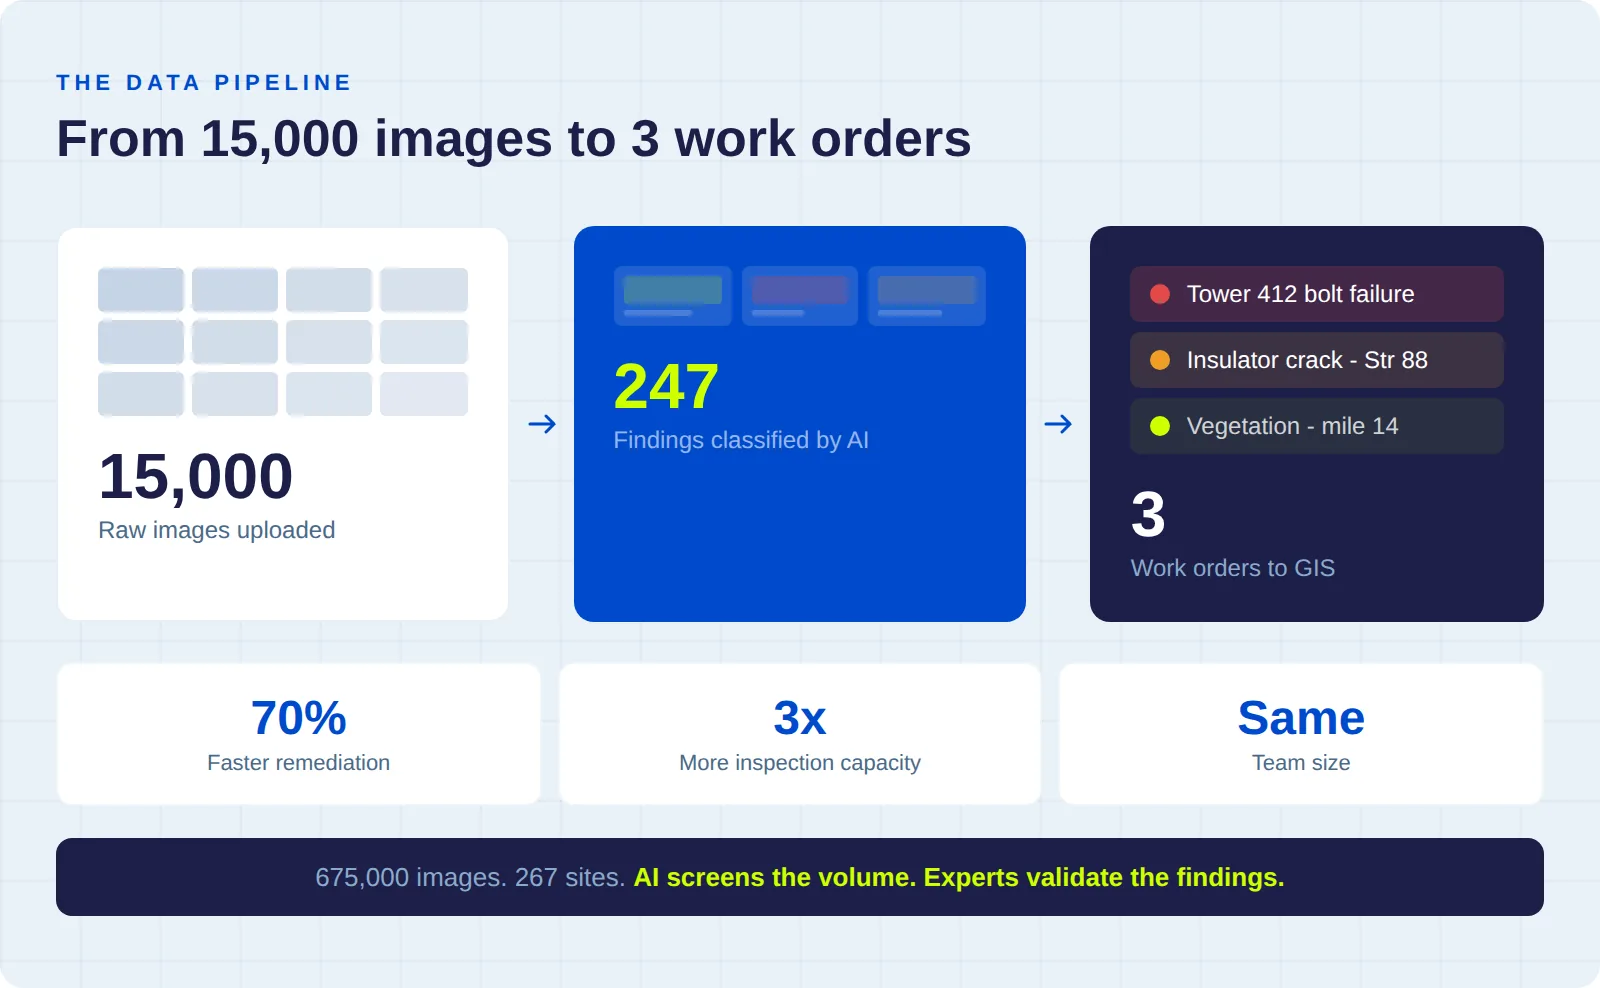
Can your workflow screen imagery for corrosion, structural fatigue, loose hardware, insulator damage, and vegetation encroachment at scale? The model that works is AI handling the volume while experts validate the findings. One utility processing over 675,000 images across 267 project sites with AI-powered analysis achieved a 70% reduction in remediation time and a 3x increase in inspection capacity using the same team.
Photo-to-structure association
Mapping thousands of aerial images to the correct structure, especially near energized transmission lines where electromagnetic interference degrades GPS accuracy, is where many drone inspection programs break down. DetectOS validates structure identity before analysis begins, because the best defect detection in the world is useless if the finding is tagged to the wrong tower.
Integration with utility asset management systems
Utilities manage assets in GIS platforms, CMMS systems, and enterprise asset management databases. They don't want a PDF report they have to manually re-enter. They want findings that route directly into their existing work order and maintenance planning workflows.
Criterion 5: Utility infrastructure domain expertise
There's a meaningful difference between a drone service provider who can fly a transmission corridor and one who understands what the utility's engineering team needs to see when they open the inspection report.
Structure types and component-level knowledge
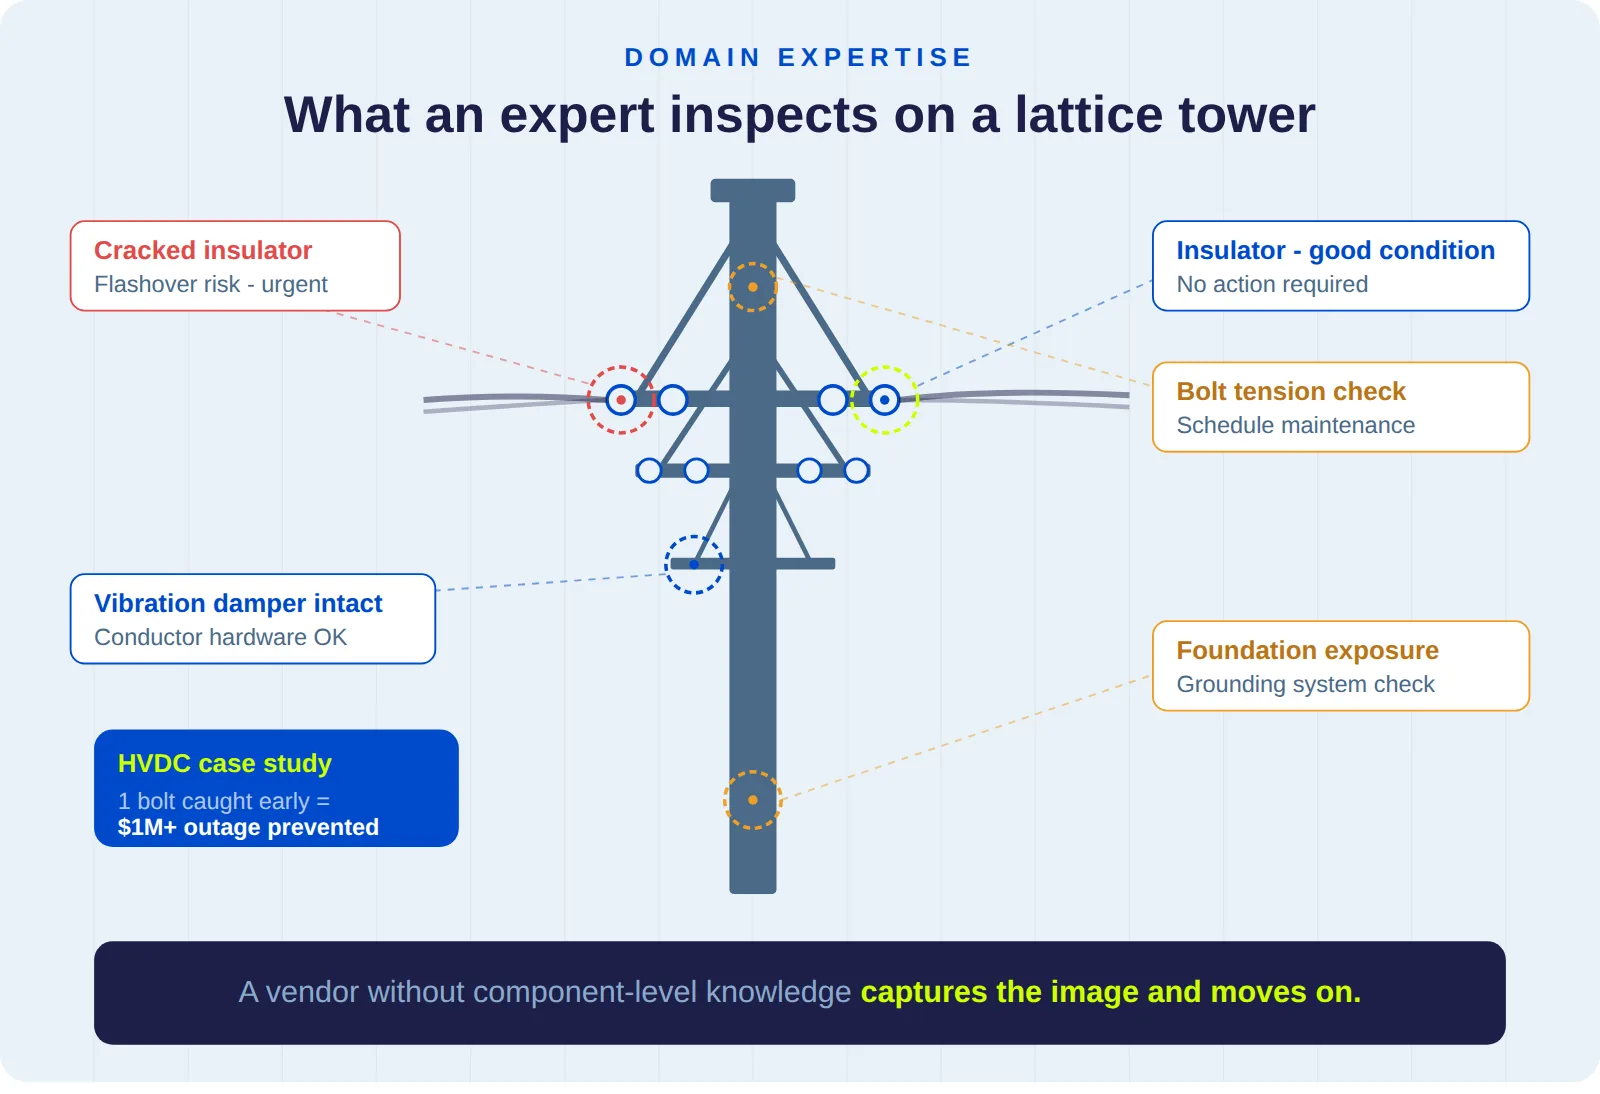
Utilities evaluate domain expertise by looking for experience with specific transmission structure types: lattice towers, monopoles, H-frames, wooden poles, guyed structures. They also assess whether the vendor understands component-level inspection requirements for insulators, conductor hardware, bolted connections, vibration dampers, and grounding systems.
EPRI standards alignment
EPRI has developed functional specifications for drone inspection systems and published research on autonomous inspection of energized structures. Their work directly influences utility procurement criteria, and vendors who can show alignment with EPRI's standards have a measurable scoring advantage.
How domain expertise prevents failures
In one of our HVDC transmission case studies, a single under-torqued bolt on a newly commissioned line was identified during a routine drone inspection. It was the kind of finding that requires knowing what a properly secured clevis assembly looks like and recognizing when one isn't right. That single finding prevented a week-long forced outage and protected more than $1 million in revenue. A vendor without that component-level knowledge would have captured the image and moved on.
Criterion 6: Drone inspection pricing and cost-per-mile evaluation
Price matters in every evaluation. But it carries less weight than most DSPs expect, and it's evaluated differently than most DSPs assume.
How utilities calculate effective cost per mile
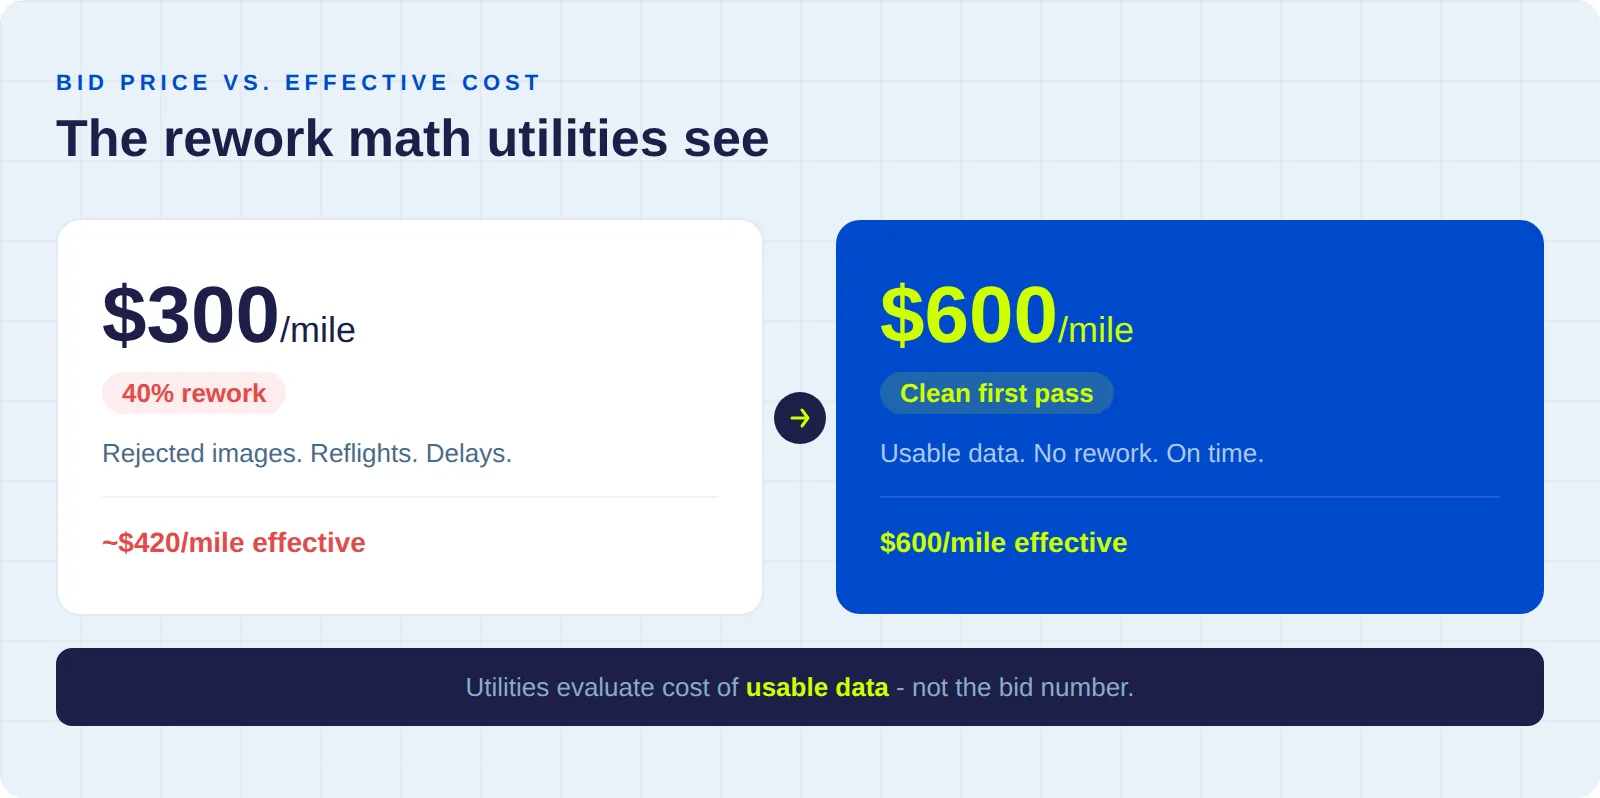
Utilities evaluate cost in context, and the context that matters most is the total cost of getting usable data. Typical rates for drone powerline inspections range from $300 to $2,000 per mile, or $150 to $500 per structure, depending on sensor requirements, terrain complexity, and deliverable specifications.
The math that actually drives the scoring: a vendor who bids $300 per mile and delivers imagery that requires 40% rework has an effective cost above $420 per mile once you add reflights and mobilization. Then factor in the two to four weeks the utility's engineering team spends waiting for corrected data. The total cost of working with the cheaper vendor ends up significantly higher than the vendor who bids $600 per mile and delivers usable data on the first pass.
Why the cheapest bid often loses
Utilities that have been through a rework-heavy contract learn to evaluate on effective cost per usable deliverable. The procurement teams that haven't learned this yet will learn it after their first experience paying twice for the same corridor.
How a real utility drone vendor evaluation plays out
Here's how these criteria interact when three vendors compete for the same utility drone inspection contract:
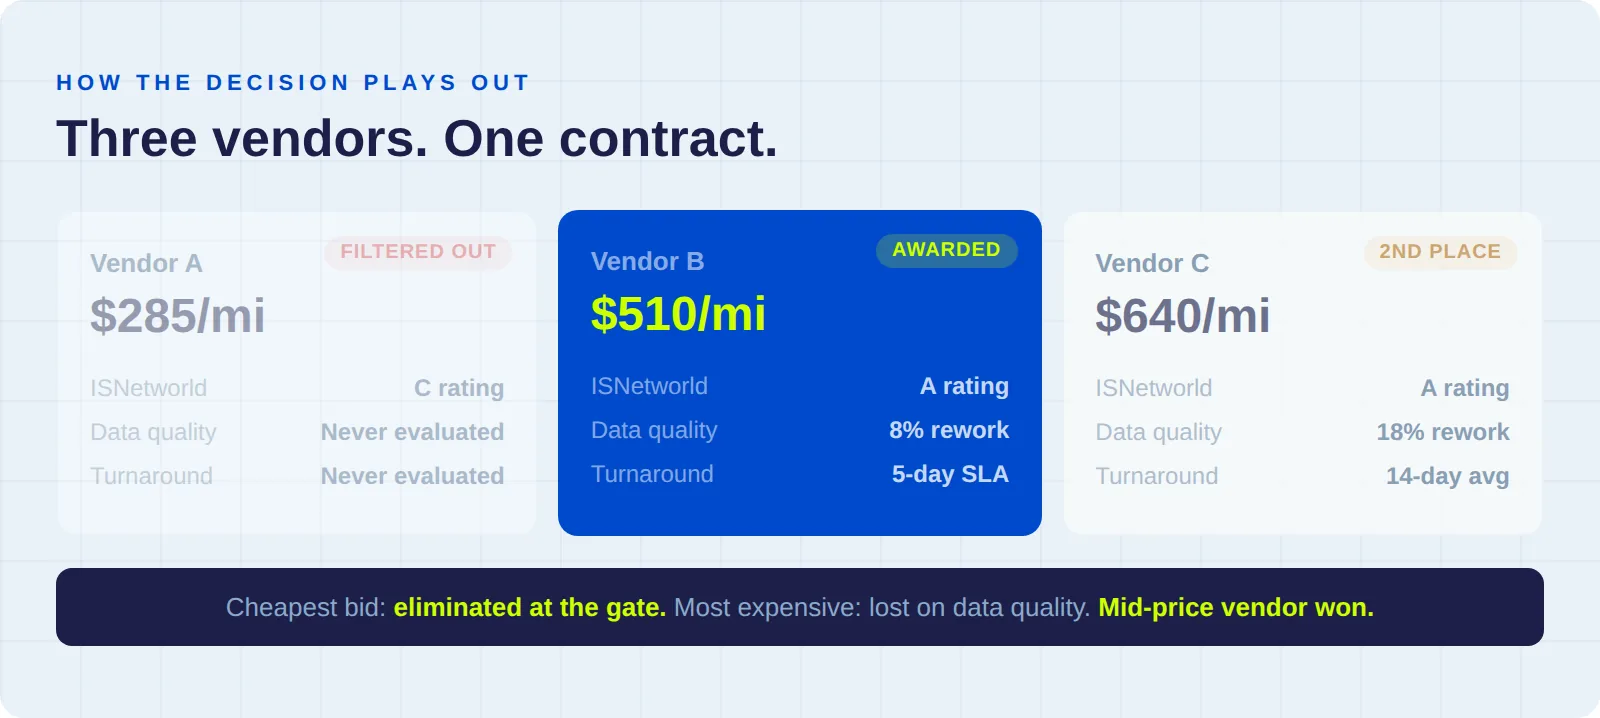
The cheapest bid doesn't even get evaluated on quality, because the vendor's ISNetworld rating filtered them out before the technical team saw the proposal. The most expensive vendor clears every gate but loses on turnaround time and rework rate. The mid-price vendor wins on data quality and delivery speed, and their total effective cost ends up lower than either competitor despite a higher sticker price.
The winning vendor isn't the cheapest or the most expensive. They're the one who understood which criteria actually carry weight and invested accordingly.
Drone inspection vendor readiness scorecard
Before you respond to your next utility drone inspection RFP, score yourself honestly on each evaluation criterion. Use a 1-to-5 scale, where 1 means you haven't started and 5 means you're fully competitive.
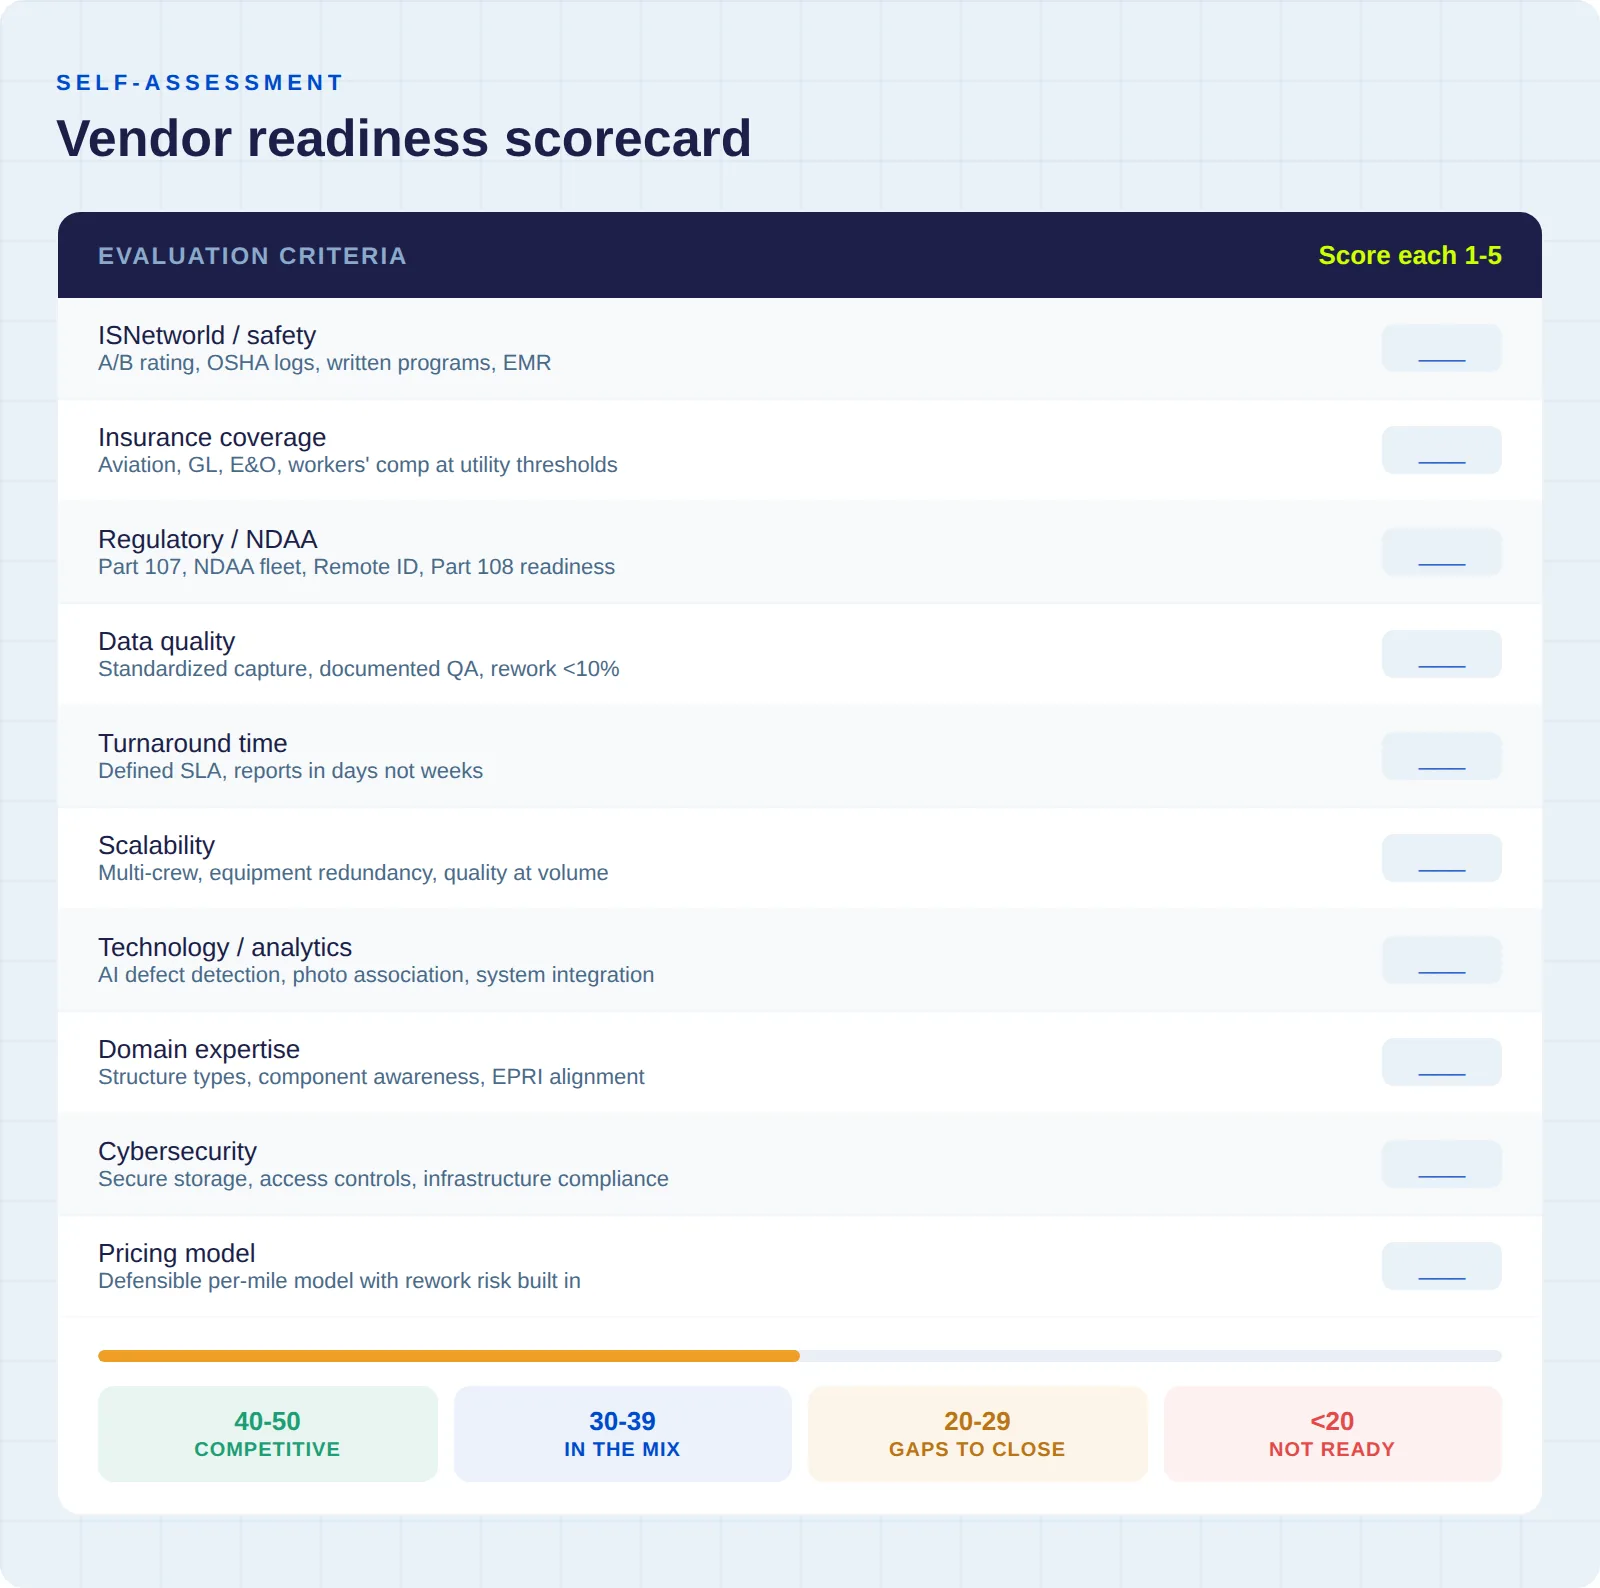
How to read your score
- 40-50: You're competitive for top-tier utility contracts. Focus on differentiation - what can you offer that other vendors in the final evaluation can't?
- 30-39: You're in the mix but probably losing on Tier 2 criteria - data quality methodology, turnaround time, and consistency at scale. That's where your next dollar of investment will generate the highest return.
- 20-29: You're likely being filtered out at the gate stage. Focus on ISNetworld, insurance, and fleet compliance before bidding.
- Below 20: You're not ready for utility contracts yet. Start with the binary gates, then build your data quality methodology.
How to improve your next utility drone inspection RFP response
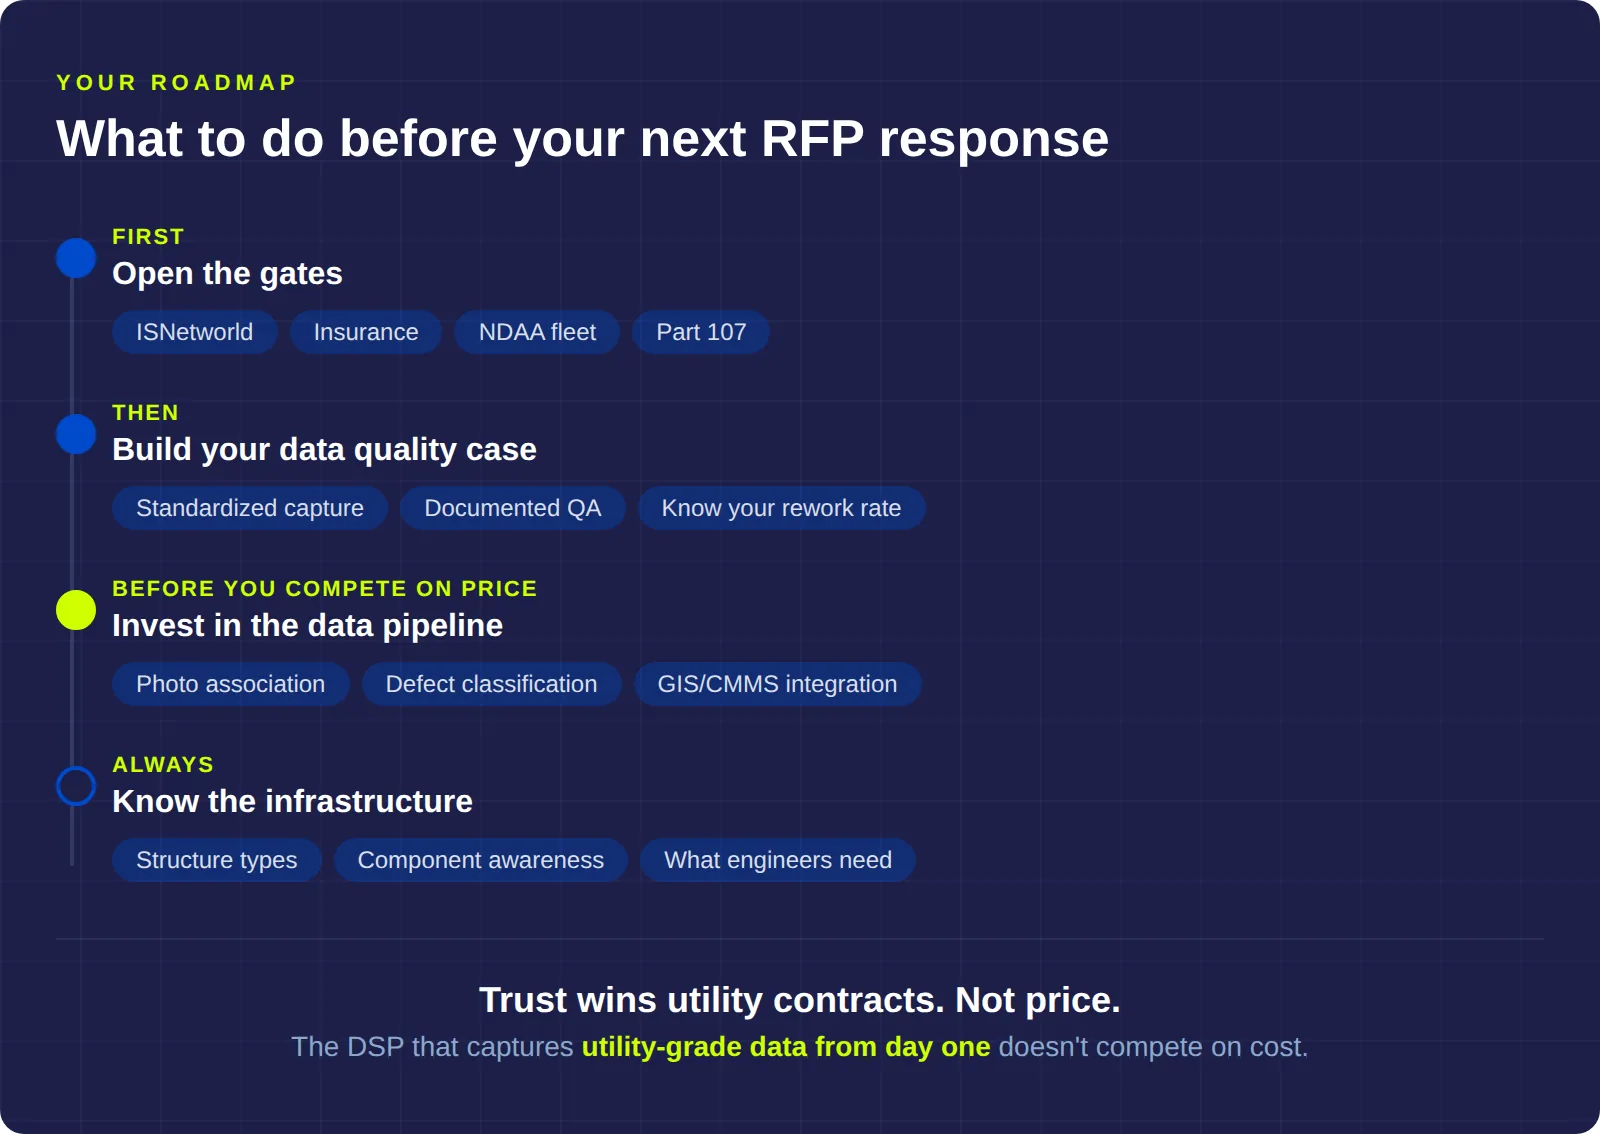
The evaluation criteria above tell you exactly where your investment will have the most impact, and they tell you in what sequence to make those investments.
Step 1: Open the gates
If your ISNetworld account isn't active and current, nothing else you do matters for utility contracts. Get your insurance to utility thresholds. Get your fleet NDAA-compliant. These investments don't win contracts, but they put you in the room where contracts get decided.
Step 2: Build your data quality case
Develop a standardized capture methodology that produces consistent results regardless of which pilot is flying. Document your QA process in a way you can present during an evaluation. Start tracking your rework rate as a metric, because the vendors you're competing against already are.
Step 3: Invest in the data pipeline
The path from raw imagery to engineer-ready deliverables is where the real advantage lives. A utility will pay more per mile to a vendor whose data reaches their engineering team in five days than to a vendor whose data arrives in five weeks at a lower rate.
Step 4: Learn the infrastructure
Know the difference between structure types. Understand what components matter for each asset class and why. Study what transmission line failure modes look like from the air and on the ground. This is the knowledge that turns an imagery vendor into an inspection partner, and it's the hardest thing for a competitor to replicate.
The DSP that captures utility-grade data from day one doesn't end up in a pricing fight. They end up in a trust conversation - and trust is what wins utility drone inspection contracts.
Detect works with both utilities and the DSPs who serve them. The Pilot Partner Program exists because we kept seeing the same problems on both sides of the table - and most of them traced back to capture methodology. If you want to see where your operation stands, we'll run a free analysis on a sample of your inspection data. No pitch. Just the numbers.
