
Inspect 10X More Utility Assets Without Hiring 10X More Crew
The inspection math is broken. Not because people aren't working hard enough — but because the model itself doesn't scale to what the grid now demands.
Somewhere in the American Southwest, a three-person drone crew wraps up a day's work. They've captured imagery of 120 transmission structures — lattice towers marching across open desert, each one photographed from multiple angles. Fourteen miles of line documented in a single shift. Fast, clean, efficient. This is the part of the inspection story the industry loves to tell.
Here's the part it doesn't.
Back at the office, 3,600 images land on an engineer's desk. Each one needs to be mapped to the correct structure, checked for quality, analyzed for defects, scored by severity, documented, and routed into a work order system. That engineer has other corridors in the queue. Last month's batch still isn't finished. The month before that is still in review.
This is where most inspection programs quietly break down. Not in the field — in the weeks and months that follow. The drone footage looks great in the proposal deck. The six-month backlog of unanalyzed imagery doesn't make the slide.
And it raises a question the industry can no longer avoid: how do you fundamentally improve utility inspection efficiency when the workforce is shrinking and the asset base is growing?
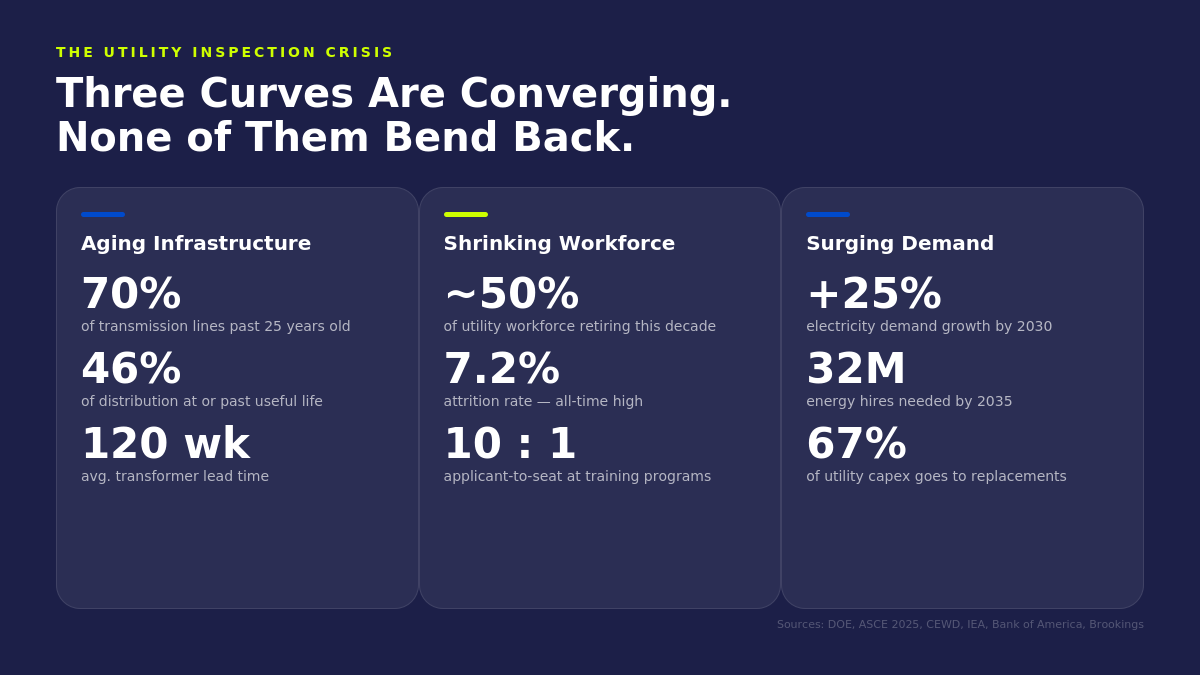
And the problem is getting worse, because the three forces shaping this industry are all moving in the wrong direction at the same time.

What you'll learn:
- Drones solved the wrong problem. The real bottleneck is the months of manual analysis after data capture — and it's where 10X gains actually live.
- The grid math is broken: 70% of transmission lines are aging out, half the workforce is retiring, and outage costs just hit $121 billion in a single year.
- Same-day intelligence changes the game. When findings arrive hours after capture instead of months later, you stop reacting and start preventing.
- You don't need 10× more people. You need a pipeline that makes each person 10× more effective.
Why the Traditional Inspection Model Is Breaking Down
There's a version of this story that's comforting: the grid is aging, but we're investing. The workforce is turning over, but we're hiring. Demand is growing, but we're building.
The data tells a different story. The grid is aging faster than investment can keep up. The workforce is leaving faster than replacements arrive. And demand is growing faster than anyone projected even three years ago.
These aren't three separate challenges. They're one compounding problem — and they converge directly on the question of how infrastructure gets inspected.
The infrastructure is aging past its design life
The U.S. power grid — 600,000 miles of transmission lines, over 180 million power poles, more than 60 million distribution transformers — was mostly built in the 1960s and '70s. It was engineered for a world of stable demand, predictable weather patterns, and one-directional power flow from large central plants to homes and businesses.
That world no longer exists. But the grid does.
The ASCE's 2025 Infrastructure Report Card gave this system a D+, down from a C- just four years earlier. That's one of only two infrastructure categories to receive a lower grade. The numbers behind that downgrade:
- 70% of transmission lines are over 25 years old, approaching the end of their typical 50–80-year lifecycle (DOE)
- 70% of large power transformers are over 25 years old
- 60% of circuit breakers have been running for more than 30 years
- 31% of transmission and 46% of distribution infrastructure is within five years of — or already past — its useful life (Bank of America)
- Transformer lead times now average 120 weeks, up from 50 weeks in 2021 (ASCE)
That last number is worth pausing on. Two and a half years to get a new transformer. If a critical unit fails tomorrow and there's no spare on hand, your replacement is arriving sometime in 2028. This isn't a hypothetical supply chain inconvenience — it fundamentally changes the economics of letting problems go undetected.
These aren't assets that might fail someday. They're assets where the probability of failure rises every year they go uninspected. And unlike buildings or bridges, transmission structures don't announce their decline with visible cracks you can spot from the road. The corrosion happens at bolt connections 80 feet in the air. The footing erosion happens under soil or standing water. The insulator degradation happens incrementally, invisibly, until it doesn't.
The workforce to inspect them is shrinking
The people who know this grid best — who can look at a 40-year-old lattice tower and tell you which connection is likely to fail next — are leaving. And they're taking decades of institutional knowledge with them.
- Nearly 50% of the current utility workforce will retire within the next decade (Department of Labor)
- Utility attrition hit an all-time high of 7.2% in 2022 (CEWD)
- 45% of experienced linemen are projected to retire in the next ten years (Lineman Central)
- Training programs report applicant-to-seat ratios as high as 10-to-1 (Lineman Central)
- In grid roles globally, there are 1.4 workers approaching retirement for every young worker entering (IEA)
- Two out of three new energy hires through 2035 will be replacements — not new capacity (IEA)
- 76% of energy and utility employers already report talent and skills gaps (ManpowerGroup via CEWD)
The Brookings Institution projects energy employers will need to hire 32 million people between 2025 and 2035 — 17 million for new roles, 15 million just to replace departing workers.
Think about what that 15 million replacement number really means. The industry isn't growing its workforce by 32 million. It's running to stand still on nearly half of them. Every dollar and hour spent backfilling retirements is a dollar and hour not spent expanding capacity to meet surging demand.
And the knowledge gap matters as much as the headcount gap. A 25-year veteran lineman doesn't just climb faster. They notice things — the discoloration pattern that signals galvanic corrosion, the hardware angle that means a bolt is backing out, the soil settlement pattern that precedes footing failure. That kind of expertise takes a decade to develop. You can't hire it at scale, and you can't train it in a classroom.

Demand is surging in the opposite direction
While assets age and workers leave, the load on the grid is climbing faster than at any point since World War II:
- Electricity demand is projected to grow 25% by 2030 and nearly 80% by 2050 (VECKTA)
- Data centers, EVs, building electrification, and industrial reshoring are all driving load growth simultaneously
- 67% of utility capital spending in 2024 went to replacements, not new construction (BofA)
That last point is the one that rarely gets the attention it deserves. Two-thirds of all the money utilities spent last year went to keeping the existing grid running, not expanding it. The system is consuming the majority of its investment just to maintain the status quo — while demand requires it to grow.
It took 117 years to build the grid we currently use. The industry is now being asked to essentially double that capacity in 25 years, while simultaneously replacing the old infrastructure, during a workforce shortage, in an era of escalating extreme weather.
Older assets. Fewer people. More demand. This isn't a future problem. It's the current operating reality.
The Real Cost of Falling Behind on Utility Inspections
Every operations leader understands, at least in the abstract, that deferred inspection increases risk. But "increased risk" is vague enough to lose a budget fight. The numbers coming out of recent research are not vague.
Outage costs are accelerating — and the trend isn't slowing
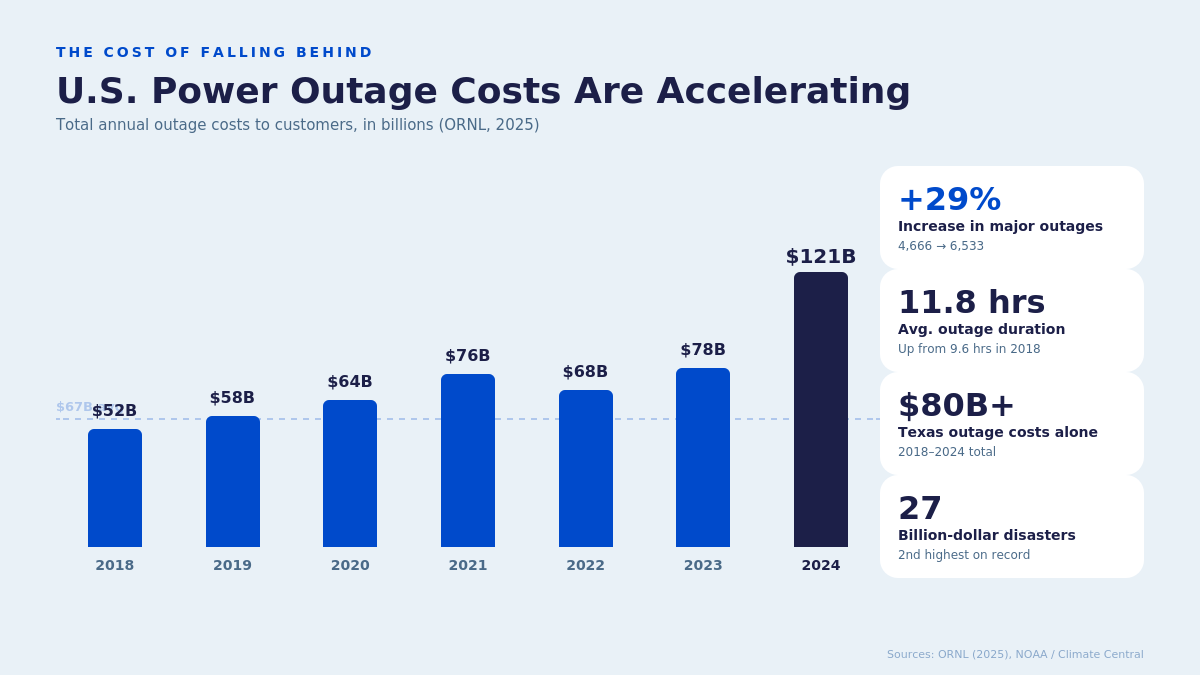
ORNL published the first comprehensive national analysis of outage costs to customers across the entire U.S. in 2025. The findings are stark:
- $121 billion in total outage costs in 2024 — up from an average of $67 billion/year over 2018–2024
- Major outages increased 29% in six years — from 4,666 to 6,533
- Average outage duration grew from 9.6 hours to 11.8 hours
- Texas alone accounted for over $80 billion in outage costs across the study period
- Commercial and industrial customers lost an average of $6,031 per outage in 2024
What makes ORNL's analysis significant is that it doesn't just count the outages — it quantifies what they cost the customers who lose power. Hospitals. Manufacturing plants. Data centers. Small businesses that lose a day of revenue they'll never recover. The $121 billion number isn't abstract damage to "the economy." It's money taken out of people's pockets, businesses' margins, and communities' stability.
Extreme weather is stress-testing compromised infrastructure
The weather isn't getting gentler. And the infrastructure it's hitting isn't getting stronger.
- 27 billion-dollar disasters in 2024 alone — second-highest in the 45-year record — costing $182.7 billion and at least 568 fatalities (NOAA)
- 23 billion-dollar events in 2025, with $115 billion in damages (Climate Central)
- 2023, 2024, and 2025 are the three worst years on record for billion-dollar disasters
- The average has surged from ~3 events per year in the 1980s to ~20 per year in the last decade
- Weather events cause roughly 80% of all outages
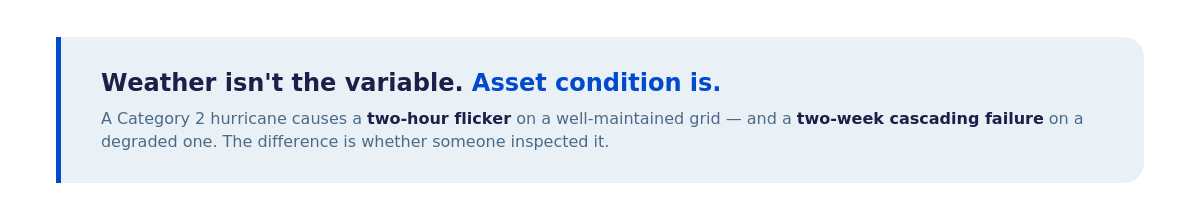
But here's the thing people miss when they see these headlines: weather isn't really the variable. Weather has always existed. Hurricanes hit the Gulf Coast before there was a grid to damage. Ice storms have always coated the Midwest.
What's changed is the condition of the infrastructure that weather hits.
A Category 2 hurricane that causes a two-hour power flicker on a well-maintained grid causes a two-week cascading failure on a degraded one. The structures that weren't inspected. The bolts that weren't torqued. The footings that weren't documented. The insulator strings no one's looked at in seven years. Those are the actual failure points.
Every deferred inspection cycle adds risk to a system already running hotter, older, and harder than it was designed for. And every year that goes by without looking at these assets, the cost of the eventual failure gets larger — not just in repair dollars, but in community impact, regulatory exposure, and the kind of front-page stories that change careers.
Where the Inspection Bottleneck Actually Lives
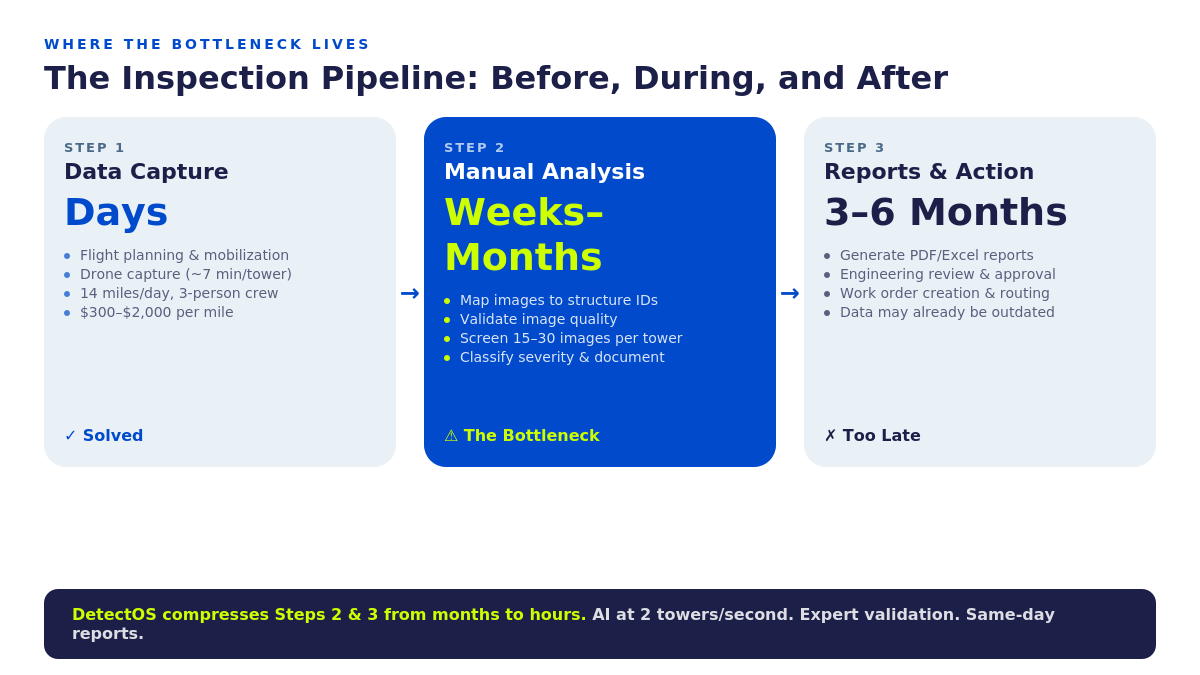
Here's what most people in the industry understand intuitively but rarely say plainly: the slow part of inspection isn't the field work. It's everything after.
The industry has spent the last decade optimizing the wrong part of the pipeline. Drones are faster. Sensors are better. Flight planning software is more sophisticated. All of that matters. But it's solving a problem that was already the least broken part of the workflow.
The real constraint lives in the gap between capturing data and turning it into a decision. This is what industry professionals call the post-capture analysis bottleneck — the labor-intensive manual process of mapping images to structures, validating quality, screening for defects, and generating reports that turns days of field work into months of back-office processing.
Before inspection: Data capture is already fast
Drones have solved the field-side capture problem. The economics speak for themselves:
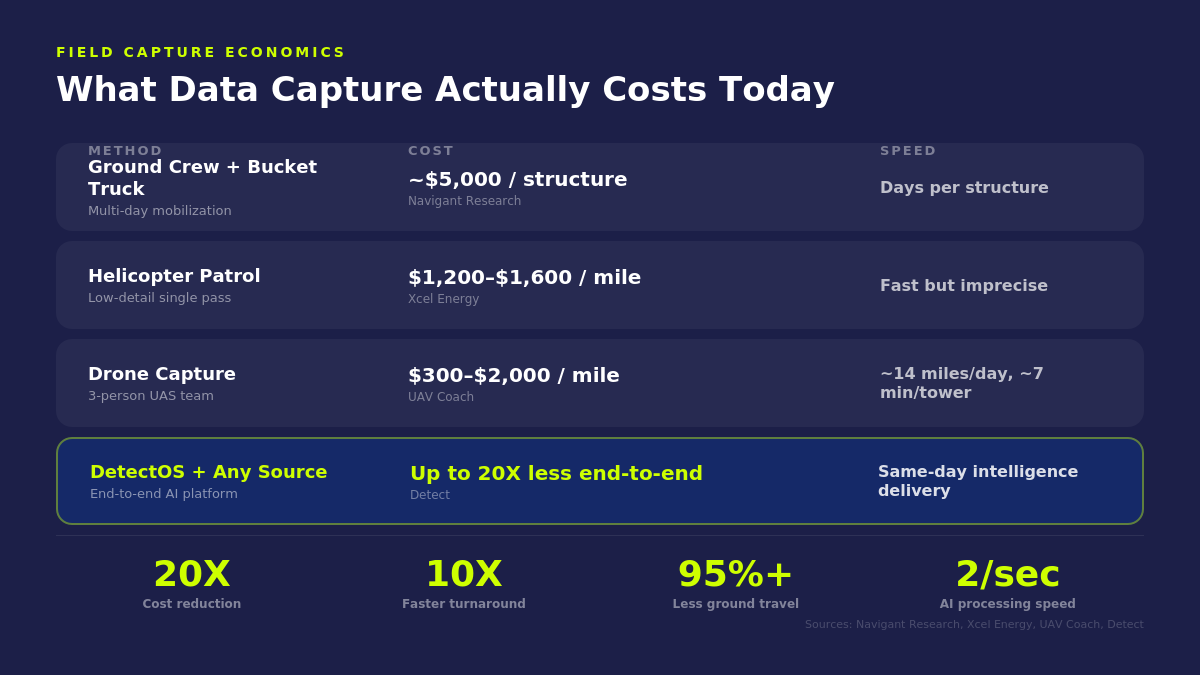
A three-person UAS team can cover 14 miles of line per day, averaging about seven minutes per tower. That's fast. That's efficient. That's not the problem.
The capture side of inspection is, frankly, a solved problem. The hardware exists. The flight planning software exists. Crews can be trained in weeks. If the only thing that mattered was getting eyes on assets, the industry would be in good shape.
But getting eyes on assets is step one of a ten-step process. And steps two through ten are where programs stall.
During inspection: The images pile up
A single transmission structure generates 15 to 30 high-resolution images from a typical drone flight. A 200-mile corridor produces tens of thousands of files. Each one needs to be:
- Mapped to the correct structure ID
- Checked for image quality (focus, angles, component visibility)
- Analyzed for defects across structural, electrical, and environmental domains
- Validated by a qualified reviewer
- Documented with severity scoring and annotated imagery
- Routed into a work order or asset management system
When this happens manually — and at most utilities, it still does — even a modest corridor inspection generates weeks or months of back-office processing. And it's not just slow — it's expensive. The engineers doing this review are the same engineers who should be making reliability decisions, designing maintenance strategies, and managing capital programs. Instead, they're matching photos to pole numbers in a spreadsheet.
The hidden cost here isn't just the labor hours. It's the opportunity cost of what those engineers aren't doing while they're buried in image review.
After inspection: Reports arrive too late to matter
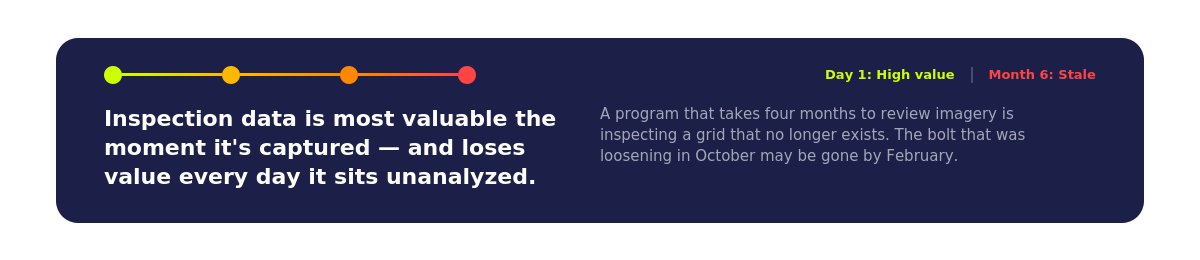
The field crew finishes in days. The engineering team is still reviewing images months later. By the time defect reports surface, conditions on the line may have already changed. A bolt that was loosening in October may be gone by February. A footing that was marginal during the dry season may be submerged after spring rains.
This is the fundamental paradox of traditional inspection: the data is most valuable the moment it's captured, and loses value every day it sits unanalyzed. A program that captures beautiful, high-resolution imagery and then takes four months to review it is, in a meaningful sense, inspecting a grid that no longer exists.
You can put more drones in the air. But if every image still requires a human to touch it four or five times, the constraint just moves downstream. You haven't solved the bottleneck. You've just relocated it.
How to Actually Inspect 10X More Utility Assets
The phrase "10X" isn't aspirational. It's a description of what happens when you collapse the manual steps between capture and action into a single integrated pipeline.
The key insight is that most of those manual steps — structure association, quality validation, initial defect screening — don't require human judgment. They require human judgment only because no one had built a system to handle them automatically. That's changed.
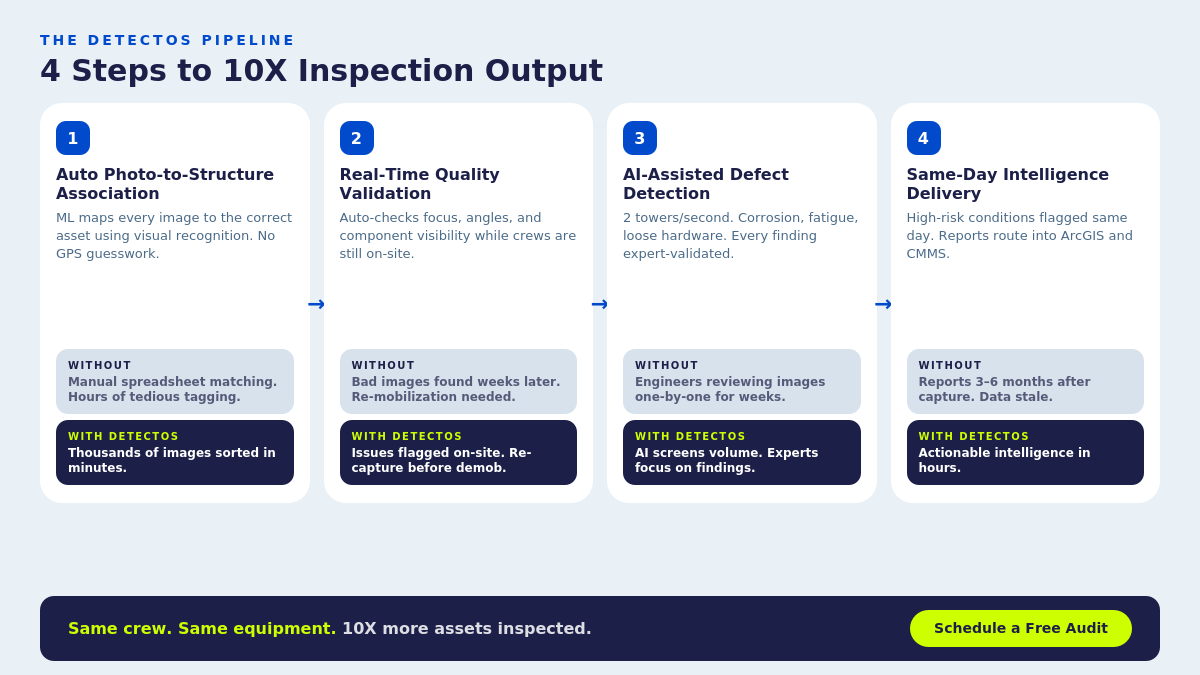
Step 1: Automated photo-to-structure association
The problem: Mapping photos to the correct asset ID is tedious, error-prone work — especially when GPS coordinates are off, structures are closely spaced, or multiple crews captured data at different times using different equipment. At many utilities, this step alone can consume more labor hours than the drone flight itself.
The fix: DetectOS uses machine learning to automatically associate every image to the correct structure using visual recognition and spatial analysis. No spreadsheet matching. No GPS guesswork. No manual tagging. The system recognizes structures the way a veteran field engineer would — by what they look like and where they are relative to each other — except it does it across thousands of images in minutes.
Step 2: Real-time image quality validation
The problem: Discovering days or weeks later that images are blurry, incomplete, or missing critical angles. The crew has already demobilized. Now someone has to go back — burning fuel, burning time, burning budget on a trip that wouldn't have been necessary if the issue had been caught while the crew was still standing under the tower.
The fix: DetectOS validates image quality automatically — checking focus, angle coverage, and component visibility — and flags issues while crews are still on-site and can re-capture. This isn't a nice-to-have. For programs operating in remote terrain or difficult-access corridors, it's the difference between a single mobilization and two. That alone can save tens of thousands of dollars per corridor, per cycle.
Step 3: AI-assisted defect detection at scale
The problem: A qualified engineer reviewing each image individually can only move so fast — and they shouldn't have to. Having a senior reliability engineer manually scan 30,000 photos for corrosion spots is like having a surgeon do intake paperwork. The skill is essential, but you're applying it to the wrong stage of the process.
The fix: DetectOS processes imagery at two towers per second — screening for corrosion, structural fatigue, loose hardware, insulator damage, and vegetation encroachment across thousands of images. But — and this is important — this isn't unsupervised automation. Every finding is reviewed and validated by certified subject matter experts. The AI handles the volume. The humans ensure the accuracy. The experts spend their time doing what only experts can do: interpreting edge cases, assessing severity, and making the judgment calls that drive maintenance decisions.
Step 4: Same-day intelligence delivery
The problem: Traditional inspection reports arrive weeks or months after data capture. By then, the information may already be outdated — and the urgency that might have prompted immediate action has been replaced by the dull bureaucracy of a report queue.
The fix: High-risk conditions surface the same day imagery is uploaded — sometimes while crews are still in the field. Complete analysis is delivered in days, not months. Reports route directly into ArcGIS, work order management, and enterprise asset databases. No separate system. No manual export. No re-keying data.
The net effect
The same crew that would have generated months of backlog now produces same-day, actionable intelligence. You're not inspecting more assets because you hired more people. You're inspecting more assets because each person's work goes ten times further.
And here's what's easy to overlook: the 10X isn't just about volume. It's about quality. When AI pre-screens every image and human experts focus their attention on confirmed findings, the defect detection rate goes up too. You inspect more and you find more.
Why "Sooner" Matters More Than "Faster"
Speed matters. But the word "faster" obscures what actually creates value. What matters isn't how quickly you inspect structures. It's how quickly intelligence reaches the people who act on it.
Calendar-based vs. condition-based maintenance
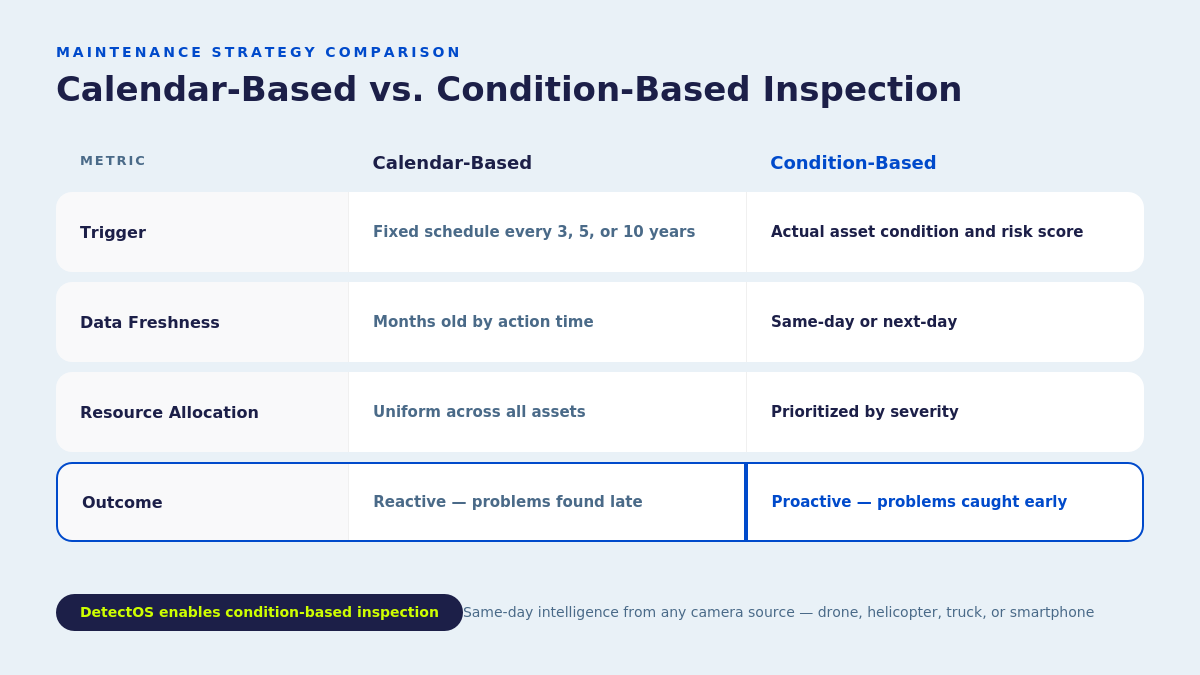
The research is unanimous: condition-based approaches reduce unplanned outages, extend asset life, and lower total maintenance costs. Everyone in the industry knows this. The principle has been accepted for years.
The reason more utilities haven't made the shift is practical, not philosophical. You can't run a condition-based program when every inspection generates months of manual processing. You end up with calendar-based inspection by default — not because you chose it, but because the analysis pipeline can't move fast enough to support anything else.
That constraint is now removed.
The Numbers That Make the Case
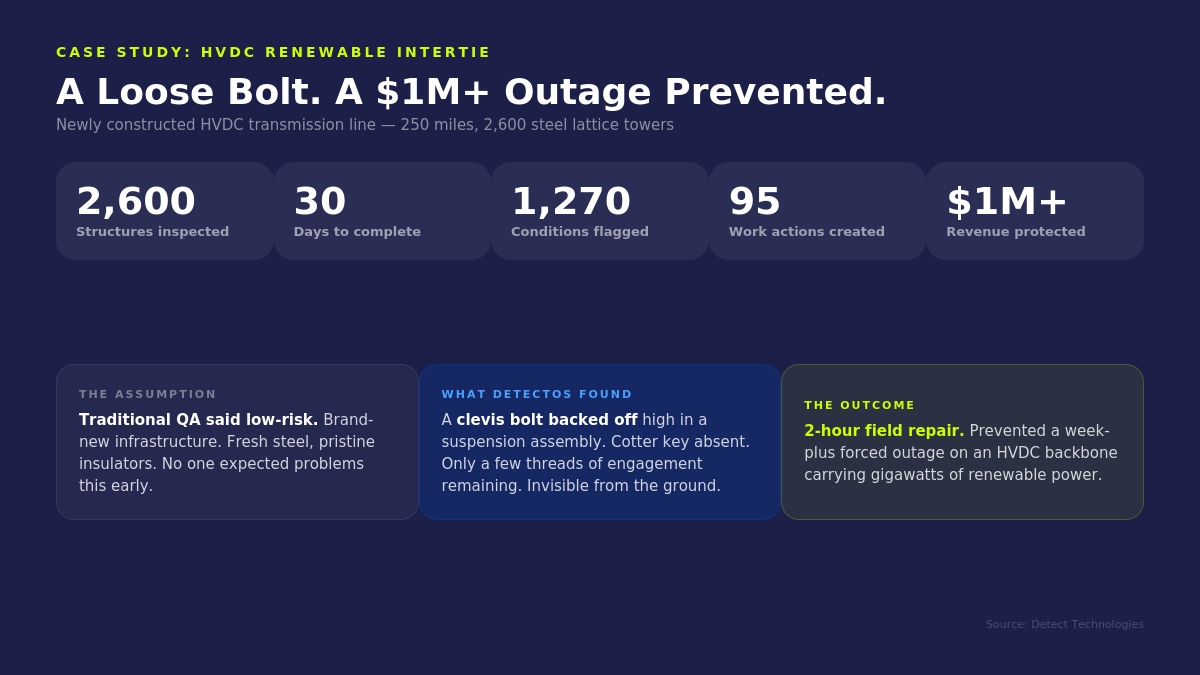
A loose bolt, a $1M+ outage prevented
On a newly constructed HVDC line — brand-new steel, pristine insulators, fresh marine cables — DetectOS flagged a loose clevis bolt that traditional QA had missed entirely. Conventional wisdom said the line was low-risk. It was new construction.
What could go wrong?
The imagery told a different story. The bolt's head was visibly backed off. The retaining cotter key was absent. Only a few threads of engagement remained. Under wind-induced gallop or ice shedding, that bolt could have dropped the conductor, triggering a forced outage on an HVDC backbone carrying gigawatts of renewable power.
Our team found it. A two-hour field repair resolved it. The utility estimated the potential outage at more than a week once site access, crane mobilization, and re-energization testing were considered. Revenue exposure exceeded $1M — before counting emergency crew premiums, replacement hardware logistics, or the cascading grid effects of losing a major transmission feed.
That same campaign — 250 miles, 2,600 lattice towers, 30 days — catalogued 1,270 discrete conditions, generated 95 prioritized work actions, and delivered a risk-scored maintenance roadmap for the entire corridor. All from a 3-person field team with drone-enabled capture feeding directly into DetectOS.
New doesn't mean risk-free. And the cost of finding that out from a failure in the field — instead of a photo on a screen — is measured in weeks of downtime and millions in lost revenue.
What This Means for Contractors Competing for Work
For utility contractors, everything above isn't just an operational story. It's a competitive one — and it's reshaping how work gets won.
The energy sector will need to hire 32 million people between 2025 and 2035. But 15 million of those are replacements, not additions. The contractors who figure out how to deliver more output per crew member aren't just winning bids. They're the only ones who can fulfill them.
What utilities are now evaluating
The RFP criteria are changing. Utilities increasingly evaluate contractors not just on crew size and safety record, but on:
- Digital documentation capabilities — can you deliver geo-tagged, annotated defect imagery?
- Audit-ready reporting — can your deliverables withstand regulatory scrutiny?
- Turnaround speed — how fast does intelligence move from capture to deliverable?
- Detection rates — are you finding more than the last provider?
- Platform integration — do your outputs plug into the utility's existing systems?
Master service agreements now routinely include these requirements. Contractors who treat inspection as a commodity — something you staff up for and grind through — are competing against organizations that treat it as an intelligence platform.

The reliability conversation
Here's the shift: the conversation used to be about cost. "How cheaply can you inspect our assets?" Now it's about reliability. "What will you find — and how quickly will we know about it?"
When your inspection program surfaces a critical defect that conventional methods missed, and the finding arrives the same day it was captured — that's not a cost story. That's a reliability story. And reliability is what utilities buy. Because the cost of one prevented outage — one week of downtime that didn't happen, one emergency mobilization that was never needed — pays for the entire inspection program many times over.
Start With the Constraint, Not the Technology
The temptation is to start with the hardware — which drone, which sensor, which AI platform. Every vendor conversation starts there because that's what vendors have to sell.
Start somewhere else. Start with the constraint.
Where in your current workflow does time accumulate? Where does labor pile up? Where do deliverables get stuck? For most programs, the answer is the same: the gap between data capture and actionable intelligence. That's where a 10X improvement lives. Not in flying faster — in thinking faster.
The organizations getting this right treat the entire pipeline — capture, association, quality validation, defect detection, expert review, documentation, work order routing — as a single integrated system. Not a collection of disconnected steps handled by different teams using different tools at different speeds.
DetectOS was designed around exactly that principle. Any camera source — drone, helicopter, truck-mounted, even smartphone. Same-day condition intelligence. Expert validation on every finding. Direct integration into the systems your teams already use. No special equipment to buy. No new workflow to learn. No separate platform to log into.
Whether you're managing transmission corridors, distribution networks, or substations — the pipeline works the same way.
The grid is aging. The workforce is shrinking. Demand is climbing.
The answer isn't ten times more people. It's making the people you have ten times more effective.
Schedule a free asset analysis → See what your current inspection program is missing.
Related reading: understand the ROI of AI asset inspection for utilities and how same-day AI triage prioritizes grid defects.
