
The Complete Guide to AI Grid Asset Photo Analysis
Between the frame a drone brings back, the work order it becomes and the record a regulator, an insurer or a contractor will one day ask for, eight things have to happen to that photo, in order. This guide walks one photo through all eight and shows what each entry lets you act on, and defend.
- Prediction needs the same component, captured sharply, tied to the right structure and compared across cycles - and even then the forecast is escalation risk and replacement timing; no date comes out of it.
- Eight entries make a photo decision-grade - Structure, View, Grade, Class, Severity, Confirmation, Direction, Export - written to one record per structure, in that order: the Evidence Ledger.
- Accuracy is per class and per condition: insulators reach 91.25% mAP in a 2025 review while small fittings stay "particularly challenging". One detector fell from 0.81 to 0.17 mAP50-95 between simulation and real flights (Faisal et al. 2025; Riss et al. 2026).
- Only a reviewer proves the scene: a hash proves the file is unchanged and metadata says when and where, which is why every finding is still confirmed by a person.
- Set retention to the longest clock: FERC keeps as-constructed photographs until the asset retires, longer than the work orders (five years) or logs (three years) they support. Federal-award records run three years past the final financial report, longer while any claim is open (18 CFR 125.3; 2 CFR 200.334).
- 13,004 Critical and High findings on one new 345kV line were fixed at the EPC's cost because each was image-linked and traceable to a structure and component (Detect CompassData 345kV case study).
A drone brings back a sharp frame of a suspension assembly. Nothing in that frame says whether the nut has backed off far enough to matter, whether it was worse last spring, or whether the frame would survive a warranty dispute. Every one of those answers is added later, by the analysis. Most guides describe the software. This one describes what happens to the photo, and names the two things it can become: a predictive maintenance signal and a claim-ready record.
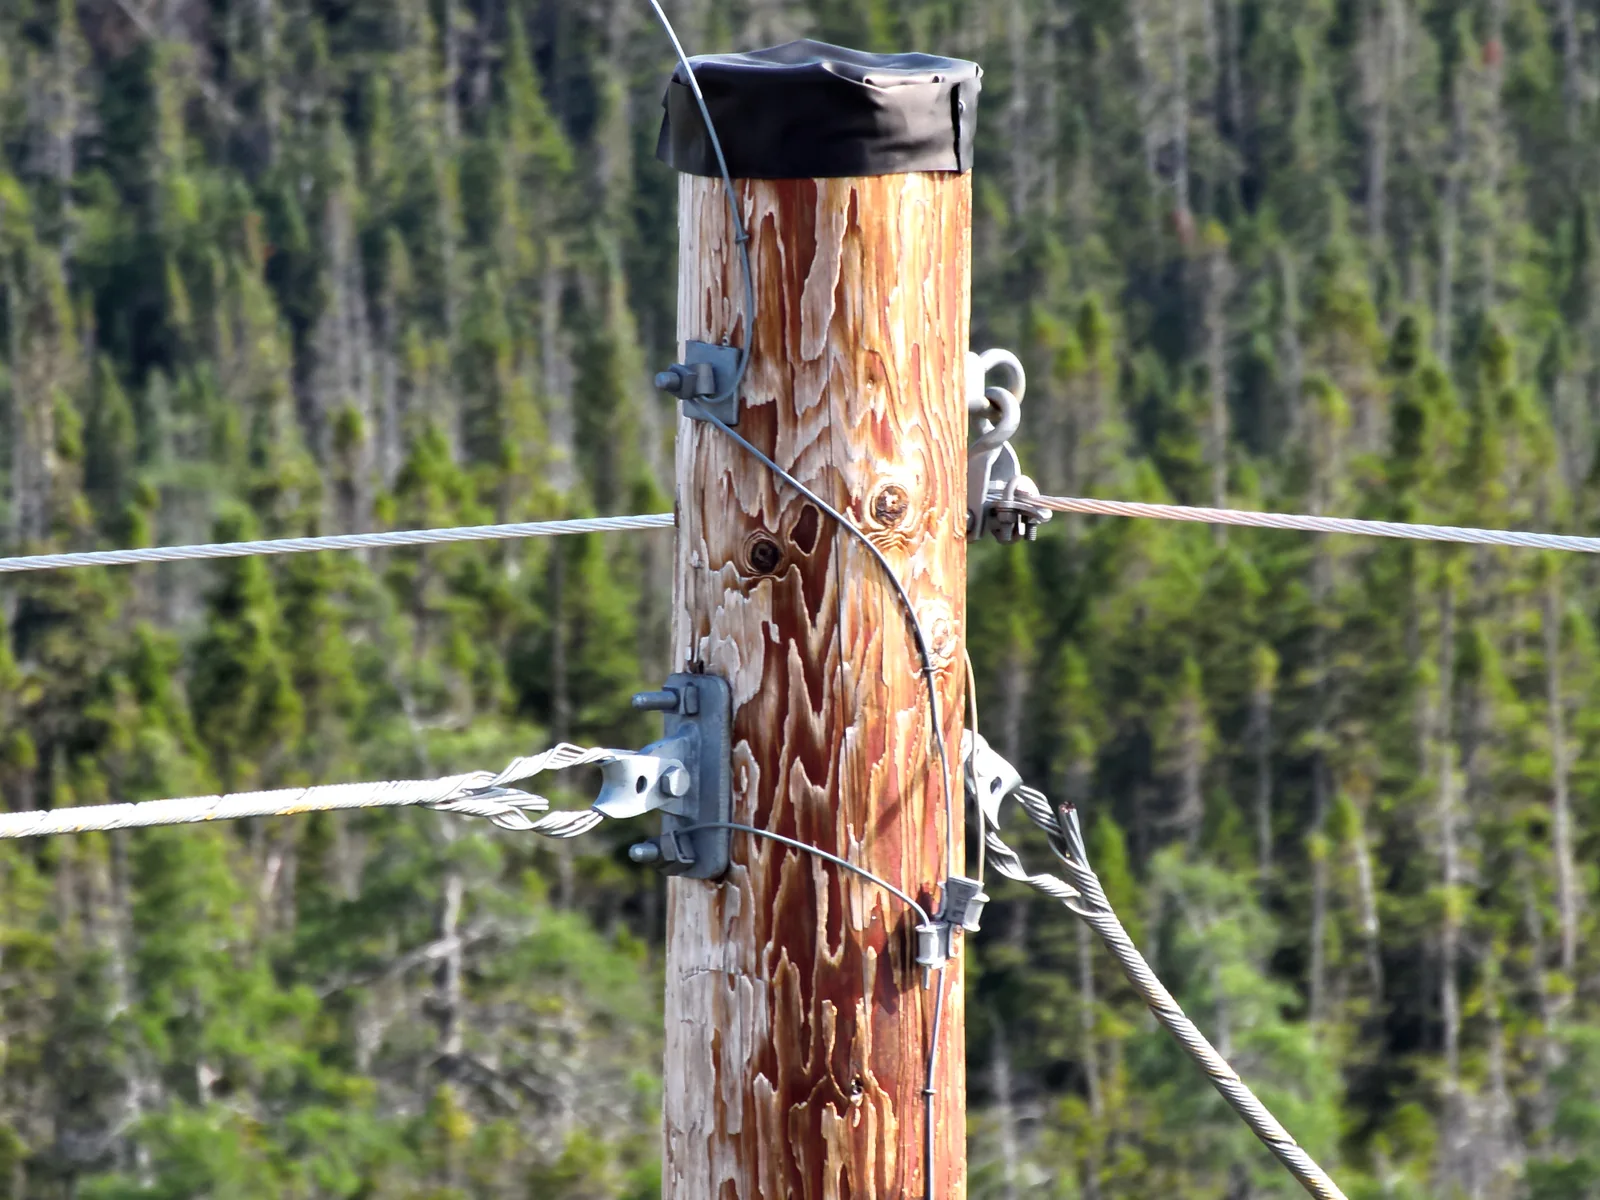
Weathered pole-top hardware. From Detect's utility inspection photo records.
What is AI grid asset photo analysis?
AI grid asset photo analysis is the use of computer vision and expert review to turn inspection photographs of transmission and distribution structures into a per-structure defect record. Each image is tied to its structure, graded for assessability, classified against a defect catalog, severity-scored, confirmed by a reviewer and compared with earlier cycles, so the record can drive maintenance and stand as evidence.
Where does photo analysis sit inside utility asset inspection?
Utility asset inspection is the whole discipline: inventories, joint-use and NESC audits, patrols, detailed and intrusive inspections, transmission line inspection and substation inspection. Photo analysis is the step that reads the imagery those activities produce. It runs on the sensors and crews you already use - drone, helicopter, truck-mounted, smartphone, satellite; RGB, radiometric thermal, LiDAR. This guide starts after the drone lands.
Much of the grid has no other condition signal. Poles, crossarms, insulators, hardware and pole-top transformers carry no sensors, so a photograph taken on a cycle is the only condition record you will hold.
What does visual data analysis of inspection imagery produce?
A defect record. On the open web, "visual data analysis" means charts drawn from tables. Here the pixels are the data, and the output is a finding with an image, a structure, a component, a defect class, a severity and a reviewer attached.
Inspection intelligence platforms are the category that does this work: they read imagery as evidence, grade capture quality first, and apply expert review to AI findings. Asset health monitoring is a different job - continuous, sensor-based, a subset of assets. Inspection is periodic, visual, and covers everything else.
Why is a defect in a photo not yet a failure prediction?
A defect in a photo is not yet a failure prediction because a photo records a condition at one moment, and a failure is a probability that needs load, environment and history the frame does not contain. It is also because the models that read photos learn from small, private datasets in which the defects that matter are rare and small.
Why are rare failure modes hard for machine learning to learn?
Because there are almost no labeled failure outcomes to learn from. A 2025 review of 73 power-line inspection papers found only 23% used a public dataset and 30% trained on more than 5,000 images; 6 of 73 released their code (Faisal et al., Qatar University and Iberdrola, arXiv preprint, February 2025). The same review names "class imbalance issues where critical components occupy only a small portion of the image".
The dataset behind many of the "above 98% mAP" insulator claims is smaller than it sounds: 600 real images plus 248 synthetic defects pasted onto backgrounds (CPLID dataset README, 2018).
The imbalance holds in the field. On one new 345kV construction program, 67 of 45,335 findings were Critical - about 0.15% (Detect CompassData 345kV case study).
How accurate is computer vision for infrastructure on real power-line imagery?
Accurate on large components, much less so on small ones. The 2025 review puts insulator detection as high as 91.25% mAP and says "detection of small-scale components like pin-bolts and dampers ... remains particularly challenging" (Faisal et al. 2025). On a 2023 public benchmark of 10,607 real drone images across 17 asset classes, the best detectors reached 0.721 Box AP and 0.891 AP50 (InsPLAD, Vieira e Silva et al., International Journal of Remote Sensing, 2023).
The sim-to-real gap comes next: the drop in a detector's accuracy between the data it was trained and tested on and real inspection flights. One insulator detector scored 0.81 mAP50-95 in simulation and 0.17 on real flights. The authors attribute the drop - more than 79% - to fogged lenses and poor light (Riss et al., arXiv preprint, February 2026). Demo accuracy is not field accuracy.
Figure 1. Published detection performance on power-line imagery, per class and per condition. Sources: Faisal et al. 2025; Vieira e Silva et al. 2023; Riss et al. 2026; CPLID README 2018.
What does asset failure prediction need that a photo cannot supply?
A confirmed defect, the criticality of the component it sits on, a severity with its rationale, and the same component seen last cycle from the same view. That chain is the subject of the next section.
The data half of this question - the reasons a photo fails before any model sees it - comes first, and utility photo data quality is where a program fixes it.
A failure date for a specific bolt from a single frame is not the state of the art. What the workflow does return is a ranked, reviewed condition record you can trend.
What does an inspection photo become at each step of AI analysis?
An inspection photo becomes a record one entry at a time. Eight things are written to it during AI analysis - Structure, View, Grade, Class, Severity, Confirmation, Direction, Export - and each is a field the next depends on. Detect calls the set the Evidence Ledger.
Figure 2. The Evidence Ledger: eight entries a photo earns before it can carry a decision. Framework: Detect, 2026. Rework figure: Detect, State of Utility Drone Inspections 2026. Assessability: Detect Data Quality Program asset-owner report.
The first three entries are written before any defect model runs - they are the three data foundations Detect's assessability guide describes from the capture side, seen here as fields on the record. The five-element actionable finding from Detect's verification checks (image, structure, component, class with severity rationale, reviewer) is entries 01, 04, 05 and 06; the Ledger adds View, Grade, Direction and Export. The Asset-Record Contract's evidence clause is what entry 08 exports.
01 - How is a photo tied to the right structure?
Adds: a verified structure ID, associated from what is in the frame and the heading, and confirmed by a person. GPS gets the frame near the right structure; the frame and the heading make the link. Fails without it: GPS-based misassociation is 35% of delivered-imagery rework, the largest single cause (Detect, State of Utility Drone Inspections 2026). Limit: a record cannot place what capture never tied.
Ten months of building a road-speed capture unit taught Detect's operations team that the hard problem was knowing which pole we had photographed; taking the picture was the easy part. On-board compute now binds each frame to one distribution structure as it is taken, so the operator sees the association before the frame enters the pipeline.
02 - Which component and which face does the frame show?
Adds: the component class and the face or heading the frame shows. Fails without it: "which insulator, facing which way?" cannot be answered a cycle later. FEMA's damage-assessment checklist asks applicants to "Include GPS coordinates and perspective (e.g., east and west) on each photograph" (FEMA Virtual Joint PDA checklist, 18 May 2021). Limit: orientation is fixed at capture; nothing downstream reconstructs it.
03 - What is the assessability grade, and why is it written before the model runs?
Adds: an assessability grade per frame - a sharpness and effective-resolution score, assigned before any model runs - and a data-confidence figure beside the health score it feeds. Fails without it: a blurry frame scores like a sharp one. Sharp capture keeps 100% of Detect's 258-type transmission catalog assessable, soft 69%, blurry 7% - each figure a share of the catalog, whatever the volume of imagery (Detect Data Quality Program asset-owner report). Limit: the ceiling is set when the shutter closes.
04 - How does AI classify defects in utility inspection photos?
Adds: a candidate defect class from the catalog, the region of the frame, the model's confidence and the model version - a proposal that waits for a reviewer's verdict. Detection finds where; classification names which type. The catalog is the shared vocabulary - Detect's transmission catalog runs to 258 defect types across 19 component classes - mapped to your own problem codes. Fails without it: one structure, three vocabularies, no trend. Limit: computer vision for infrastructure tops out where the fittings get small.
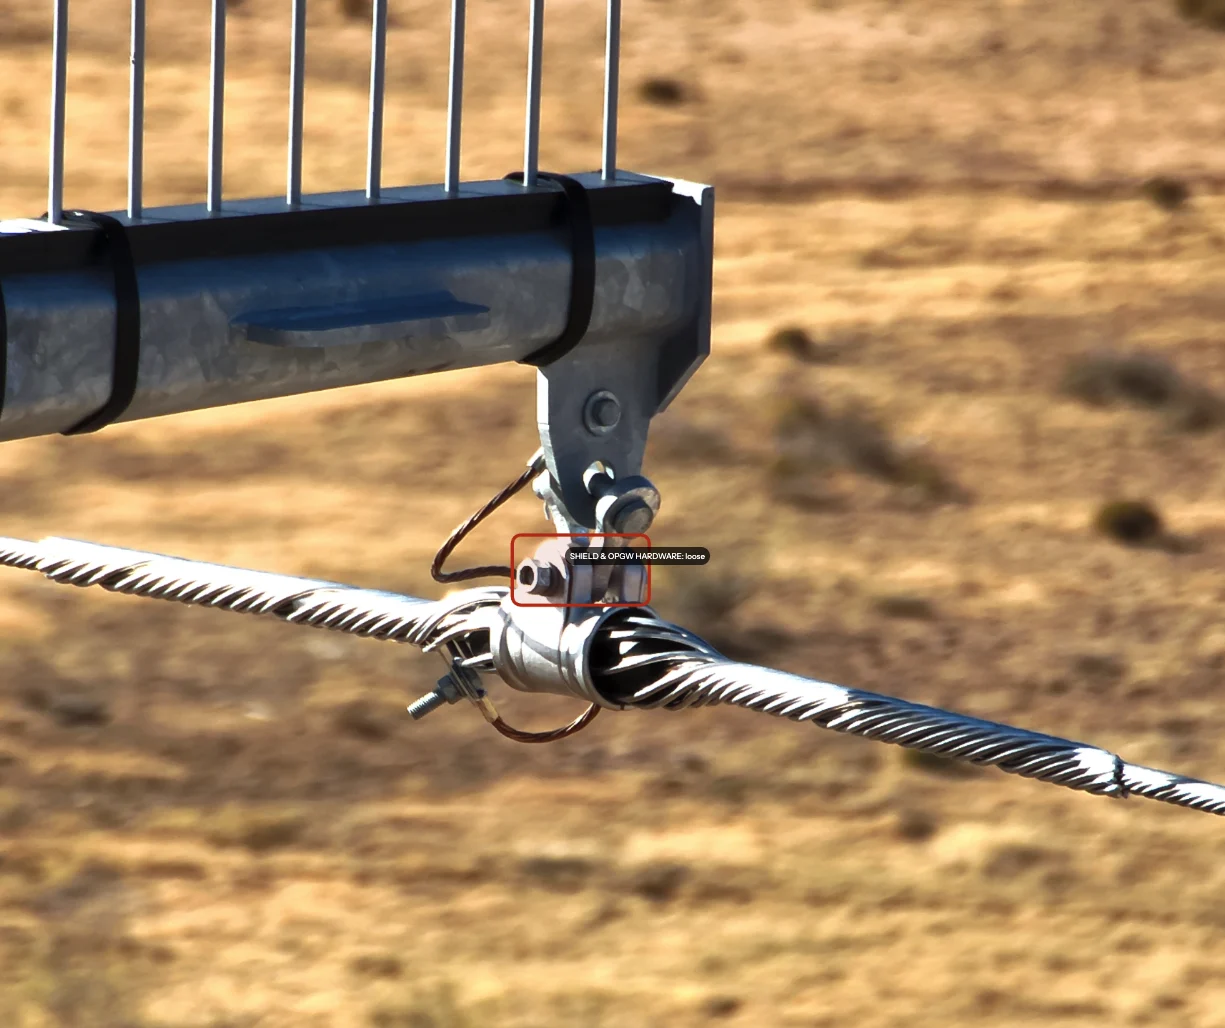
Entry 04, on the frame: a loose-hardware annotation on a shield-wire suspension clamp. Detect · demo environment
05 - How is defect severity scored from a photo?
Adds: a severity, the component's criticality, a written rationale - what is loose, missing, cracked or corroded, and how far along - and a scheduled corrective date. Severity is a judgment about consequence: a backed-off nut on a load-bearing clamp outranks surface rust on a plate, whatever the model's confidence in either. Fails without it: labels without criteria cannot be audited, ranked or compared across crews. Limit: critical findings are rare, as the 345kV share in the last section shows, so severity exists to pull them out of the rest.
06 - Who confirms the finding, and how is that written down?
Adds: the reviewer's name, the decision - confirm, edit or reject - and a sign-off timestamp. Every detection is reviewed by a person, and "nothing is auto-approved" (Detect, The new DetectOS, August 2026). Fails without it: a hash and a metadata tag prove the file; only a person proves the scene. Limit: a reviewed finding is never re-scored by a migration. Whether a vendor writes this entry at all - a named reviewer on every flag, a rejection rate you can see - is what the Evidence Audit's seven checks test.
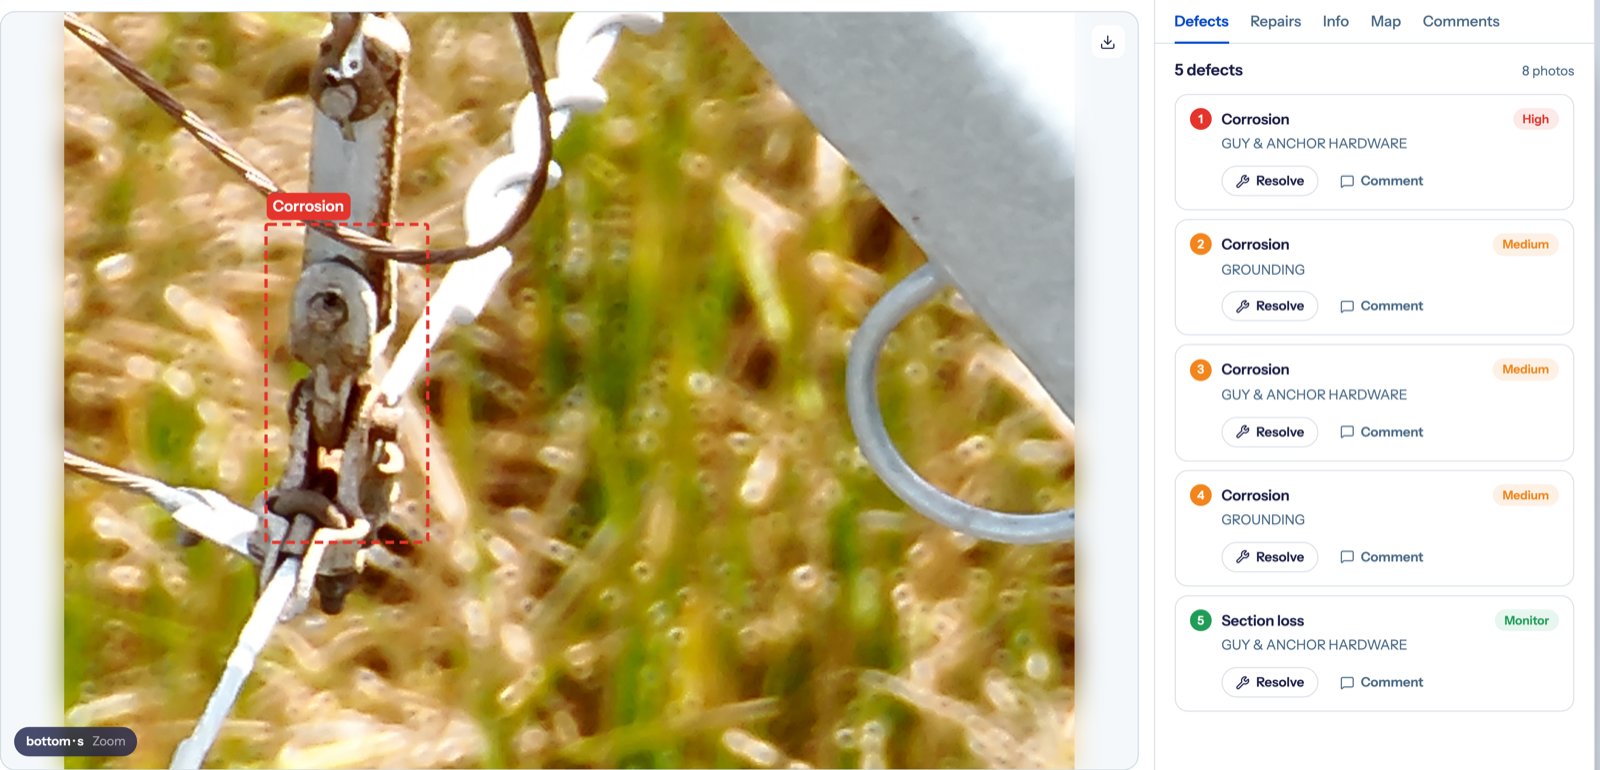
Entry 06: the review workspace - findings on the image, reviewed and signed off by people. Detect · demo environment
07 - How does a finding become a direction?
Adds: a prior-cycle reference to the same structure from the same view, the direction of change, and a time-to-action window. Fails without it: every cycle is a snapshot; no forecast. Limit: the record forecasts escalation risk and replacement timing; a date is beyond it. Direction is the entry that moves a program up the Snapshot-to-Forecast ladder; without it every cycle, however sharp, is rung one.
08 - What does exporting the record mean?
Adds: one system-generated record per finding - image, structure, view, class, severity rationale, reviewer, timestamp - hashed, in the format each audience accepts, retention flag set to the longest clock. Fails without it: a folder named after the flight date, which no record schedule recognizes. Limit: a hash proves integrity alone; veracity is entry 06's job. This export is what the Asset-Record Contract's evidence clause assumes when it says the image, the reviewer and the timestamp travel with every finding into the work order.
A complete record is what makes power grid outage prevention possible this season. The model on its own promises nothing.
What does AI visual predictive maintenance for power grid assets need from the record?
AI visual predictive maintenance for power grid assets needs five things from the same record: a confirmed defect, the criticality of the component it sits on, a severity with its rationale, the direction of change against the previous cycle from the same view, and a time-to-action window. Together they are a predictive maintenance signal. Without the cycle-over-cycle entry, the record is a snapshot.
How does comparing this cycle's image against last cycle's reveal a developing failure?
Only when three things match: the same structure, the same component from the same view, and one taxonomy. Then a crack's growth or a nut's travel is measurable, and the record carries a direction.
This is why entries 01, 02 and 04 exist. Without a verified structure, cycle two lands on a different pole than cycle one; without a classified view, the record cannot tell a worsening defect from a moved camera. And a defect that carries three names trends as none of them.
Visual forecasting is strongest at escalation risk and replacement timing, and the five fields above are what it is built from.
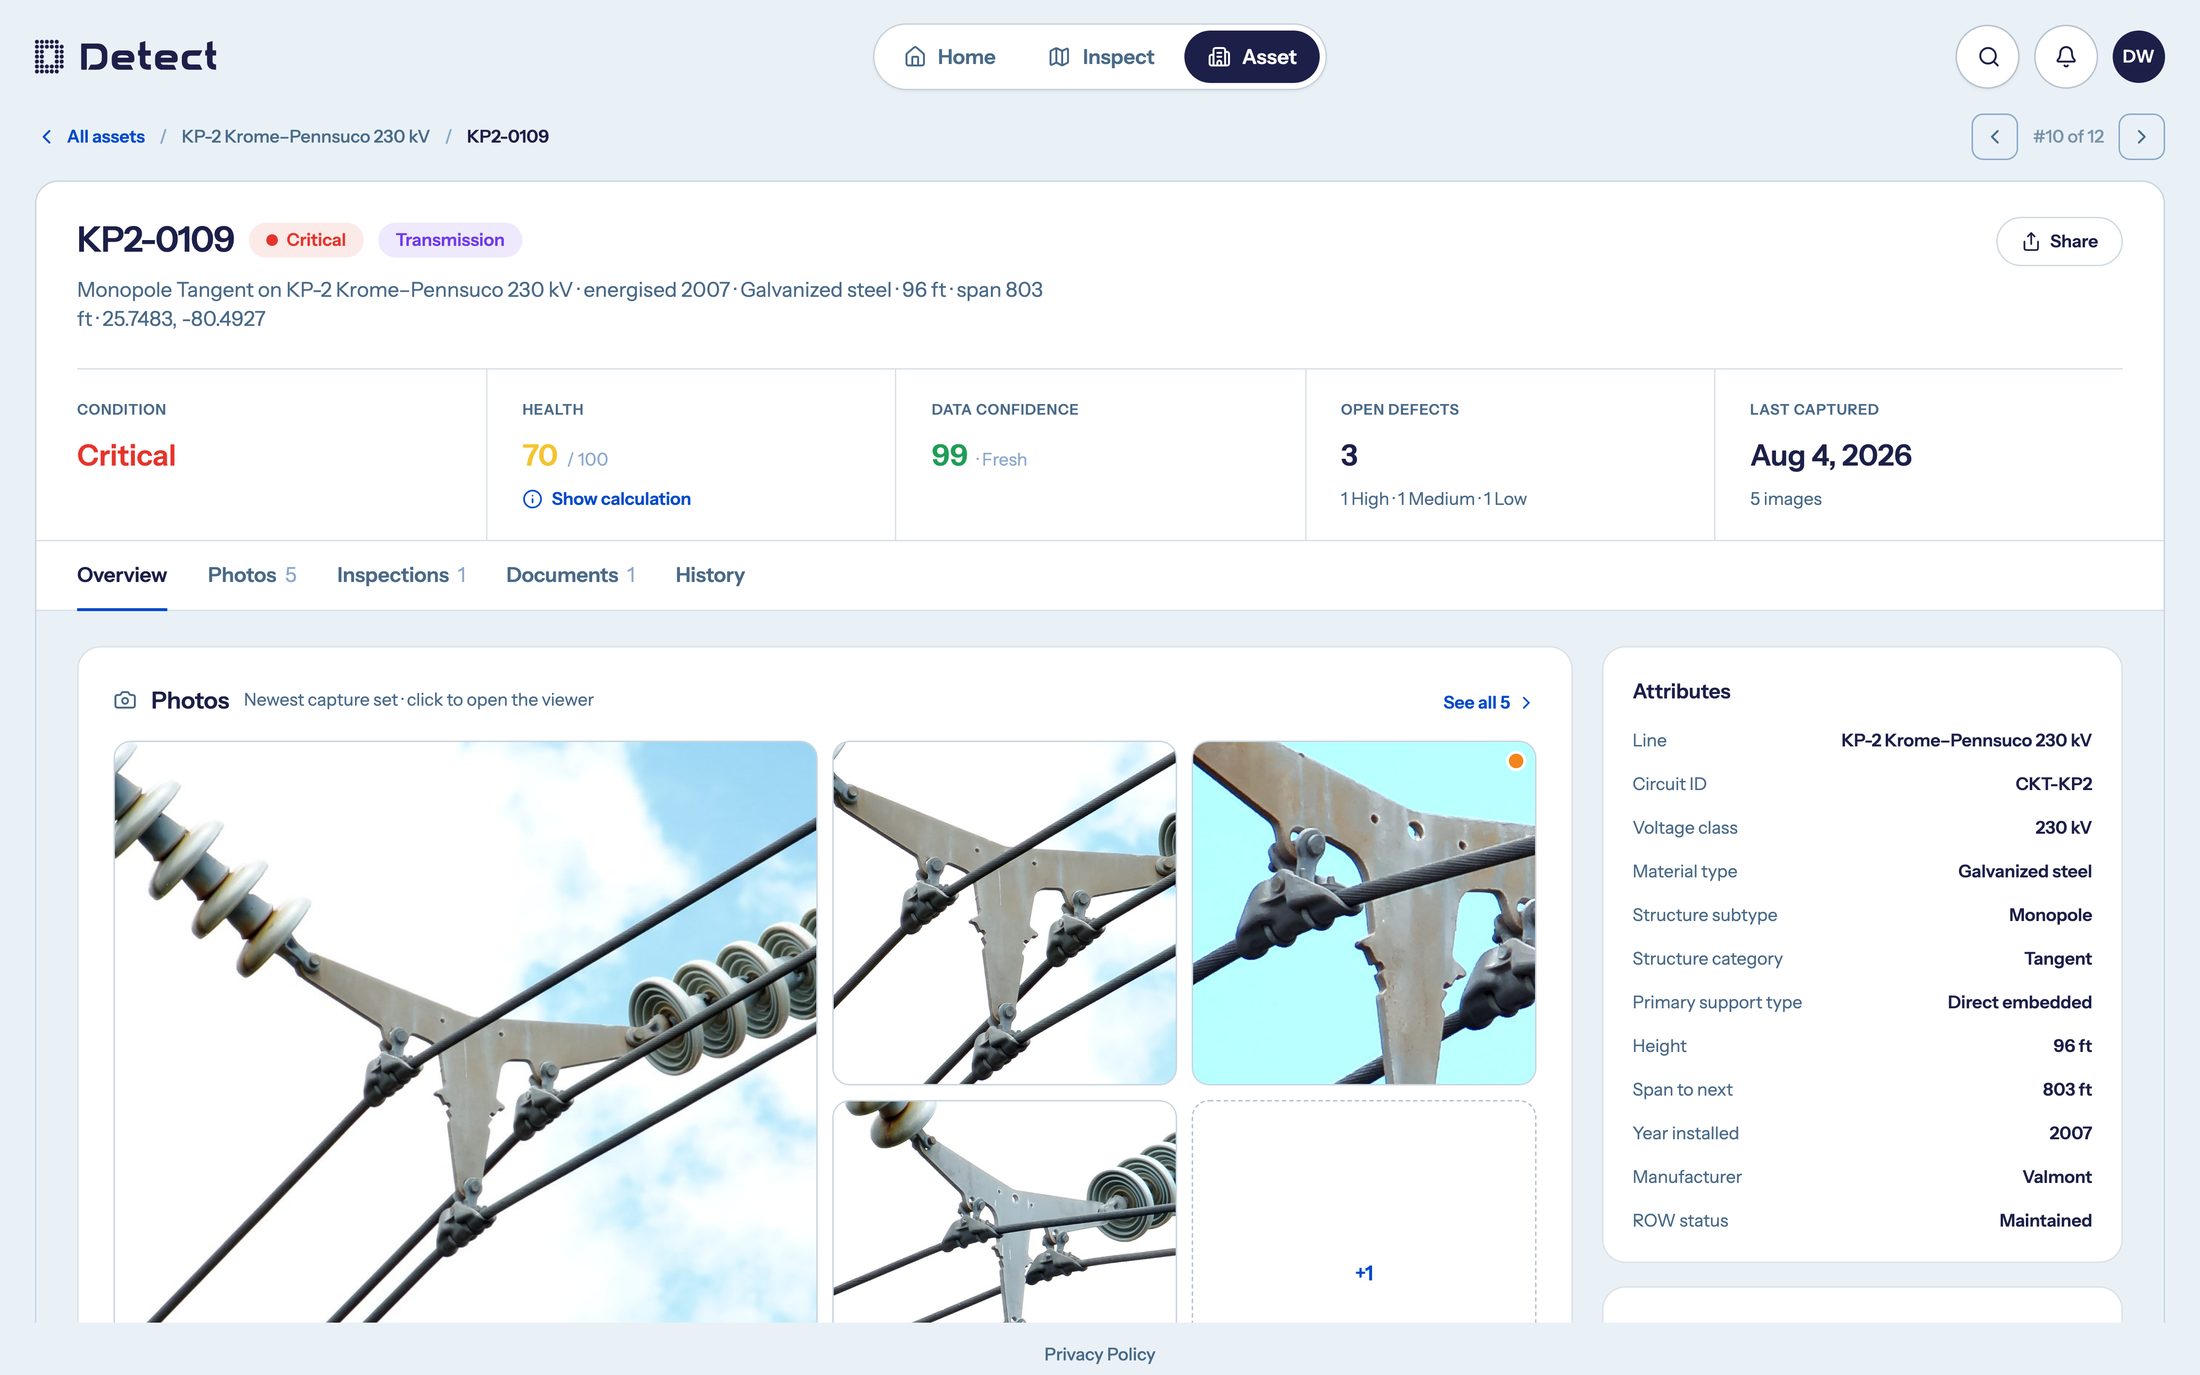
One record per structure, across every inspection - the record the Direction entry is written to. Detect · demo environment
What does power grid outage prevention look like inside the review queue?
It looks like a short list. The AI screens the volume, reviewers confirm what matters, and the highest-consequence findings reach crews first - a missing cotter key on a suspension assembly ranked above every cosmetic finding on the line.
The signal is what the queue is sorted by. A confirmed defect on a critical component, with a rationale, a direction of change and a window, sits at the top. A confirmed cosmetic finding with no movement since last cycle sits at the bottom. Your experts spend their hours on the first kind.
Power grid outage prevention is what the signal is for this season. Asset life and capital planning are what it is for next year - the same record, read over a longer horizon.
What makes an inspection photo claim-ready evidence?
An inspection photo is claim-ready evidence when three things are true: its structure, view, grade, defect class, severity rationale, reviewer and timestamp were written at the moment of analysis; the exported record is bound by a hash; and it is kept for the longest clock any regulator, insurer, federal program or court can put on it. Evidence is the record; the photo is one field in it.
Utilities have other names for it - audit-ready record, defensible record, FEMA Public Assistance documentation, wildfire inspection records, chain of custody. This guide uses one term for all of them: claim-ready.
In a report dated 2 September 2026, the DHS Inspector General found that FEMA's small-project rule had required pre- and post-event photographs only "if available" since 13 March 2020 (DHS OIG-26-25). The same report cites a claim for two miles of road and nine culverts where the photographs covered less than a third of a mile and three culverts; FEMA obligated $534,888 on photographs it had made optional.
FERC's own schedule makes the point from the other side: photographs of as-constructed facilities are kept until the asset retires, longer than the work orders or logs they support (18 CFR 125.3). The photo outlives everything else in the file.
Which fields does a regulator require on the record, and who asks for each?
Eight fields, each mapped to the rule that asks for it and the clock it starts.
| Field on the record | Ledger entry | Who requires it (source, date) | Retention clock (source) |
|---|---|---|---|
| Photo file + hash (hard binding) | 08 Export | FRE 902(14), eff. 1 Dec 2017; C2PA 2.2, 1 May 2025: one hard binding per manifest, SHA2-256/384/512 | As-constructed photographs: "Retain until retired" (18 CFR 125.3; adopted for cooperatives via 7 CFR 1767.67) |
| Reviewer identity + decision + sign-off time | 06 Confirmation | FRE 902(13): certification by a qualified person | Follows the finding; on a federal award, three years from the final financial report, longer while open (2 CFR 200.334) |
| GPS coordinates + viewing perspective | 01-02 Structure / View | FEMA PDA checklist, 18 May 2021: "Include GPS coordinates and perspective (e.g., east and west) on each photograph" | Per federal award: 2 CFR 200.334 |
| Defect class + severity rationale + scheduled corrective date | 04-05 Class / Severity | CPUC GO 165 §IV: "any problems ... identified ... as well as the scheduled date of corrective action" | Maintenance work orders: five years (18 CFR 125.3) |
| Prior-cycle reference + direction of change | 07 Direction | FEMA pre-disaster condition review (DAP 9580.6, 2009) | Federal-award records: three years, extended while open (2 CFR 200.334) |
| Structure / circuit / facility identity | 01 Structure | CPUC GO 165 §IV: "the circuit, area, facility or equipment inspected" | Ten years patrol and detailed; life of the pole intrusive; 30 days' notice (GO 165) |
| Timestamp + inspector / capture source | 01-02 | GO 165: inspector and date; NERC FAC-003-5 M6: "dated inspection records" | Three calendar years (FAC-003-5) |
| Assessability grade + data-confidence | 03 Grade | Detect practice (Detect Data Quality Program asset-owner report); no external rule names it | - |
How long must utilities keep inspection photos and work orders?
For the longest clock any audience can start. The clocks differ by audience, and the one that matters is the one you did not expect. Two clocks are written in the rule text itself: FERC's schedule (18 CFR 125.3), and the federal-award rule - three years from the final financial report, longer while any claim, audit or litigation is open (2 CFR 200.334).
Figure 3. The retention clocks: five clocks an inspection record can be on at once - set retention to the longest. Sources: 2 CFR 200.334 (2024 revision); 18 CFR 125.3 (FERC Order 617; adopted by RUS via 7 CFR 1767.67); NERC FAC-003-5 (2022); CPUC General Order 165 (D.17-12-024).
How does one record serve storm, wildfire and warranty audiences?
Storm. FEMA Public Assistance asks what the structure looked like before the event, and the prior cycle's record is the answer. A per-photo structure, view and date is what FEMA's damage-assessment checklist asks for. FEMA's "perspective on each photograph" is entry 02, the field Detect calls orientation tracking.
Wildfire. California's wildfire-safety regulator already treats inspection photos as structured data: its GIS data standard carries an "Asset Inspection Photos" table and a PSPS damage photo log (Energy Safety GIS Data Reporting Standard v2.1, September 2021). The same record that ranks wildfire-risk spend is the record that stands behind a wildfire mitigation plan filing, an underwriter's renewal questions and a board's. This is where electric utility asset management stops being a register and starts being a defensible record.
Warranty. An image-linked register - structure and component, severity, date - is what compels a contractor to act inside the window.
13,004
On one newly built 345kV line, 45,335 findings across 927 structures were image-linked and traceable to a specific structure and component. Every Critical and High finding was repaired before the warranty window closed. Source: Detect CompassData 345kV case study.
What the contractor received was the export: an image-linked register of every Critical and High finding, fixed at the EPC's cost inside the warranty window.
What can a hash, a timestamp and a reviewer each prove?
A hash, a timestamp and a reviewer each prove a different thing. A hash proves integrity - the file has not changed since it was hashed. A timestamp and its metadata speak to provenance - when and where the file came from, and only alongside other elements. A reviewer's confirmation is the only layer that speaks to veracity - whether the scene shows a real defect on a real structure.
Figure 4. Three layers of proof: what a hash, a timestamp and a reviewer each establish, and the one only a person can write. Sources: Federal Rules of Evidence 902(13)-(14); C2PA Technical Specification 2.2; SWGDE Best Practices for Image Authentication 18-I-001-2.0 (paraphrased).
Why is expert review an evidentiary requirement, not a feature?
Expert review is an evidentiary requirement because a hash and a timestamp prove the file and only a person's confirmation proves the scene. Integrity first. The C2PA industry standard names a cryptographic hash as the simplest hard binding between a manifest and its image. A hard binding reveals a pixel change and nothing more (C2PA Technical Specification 2.2, 1 May 2025). Federal Rule of Evidence 902(14) lets certified copied data authenticate itself, and it authenticates the copy alone - it says nothing about the condition in the frame (effective 1 December 2017).
Provenance next: capture time, GPS and device metadata say when and where a file came from, which is a claim about the file's history and says nothing about what the pixels show. SWGDE says metadata "cannot be relied upon in isolation" and that a hash "cannot demonstrate the veracity of the scene depicted" (SWGDE 18-I-001-2.0, 3 March 2025).
Veracity last, and only entry 06 speaks to it. A named reviewer's confirmation is the one layer that says the scene shows a real defect on a real structure. FRE 902(13) then lets a system-generated export authenticate itself on a qualified person's certification. That is Detect's Hybrid AI + Expert Review model stated as an evidentiary rule.
Can annotated inspection images still serve as evidence?
Yes, when you preserve the original frame unchanged and hashed, and keep the annotation as a separate layer carrying its own reviewer and time. An annotation that overwrites the original breaks integrity, provenance and the reviewer trail at once.
Which platforms turn grid inspection photos into predictive maintenance signals?
Two kinds of platform turn grid inspection photos into predictive maintenance signals, and they differ in where each starts on the Ledger: one consumes a finished finding, the other reads the photo itself and writes every entry of the record.
Are predictive maintenance platforms and photo analysis platforms the same thing?
Predictive maintenance platforms that analyze visual data for grid assets fall into two groups: sensor-led APM systems that add an imagery module, and inspection intelligence platforms that read drone and ground photos as evidence - grading capture quality, confirming findings with experts, and trending condition across cycles. DetectOS is Detect's platform in the second group.
An APM system starts at entry 05 or 06 - a structured finding with a severity - and adds probability-of-failure and remaining-useful-life math from sensors and history. An inspection intelligence platform starts at entry 01, the pixel and the structure ID, and hands the outputs of entries 05 through 08 to the APM, GIS and work-order systems you already run: IBM Maximo, SAP, Esri ArcGIS.
That gives you one test for the AI utilities inspection workflows on your shortlist: ask which of the eight entries each platform writes, and which it expects you to supply. Once you know which entries a platform writes, the Grid Inspection AI Scorecard scores the analysis layer on seven weighted criteria.
How do you start AI grid asset photo analysis on your own imagery?
You start AI grid asset photo analysis on your own imagery by running the Ledger on ten structures before you buy anything: pull their photo history and count which of the eight entries exist today. The missing entries are the plan.
- Audit ten structures against the eight entries. Pull each structure's photo history and mark which entries exist: structure link, view, grade, class, severity with rationale, reviewer and timestamp, prior-cycle comparison, hashed export. The gaps are the scope.
- Run one claim drill. Take one confirmed finding and assemble the packet a FEMA site inspector, a GO 165 audit or an EPC warranty notice would ask for. Whatever you cannot produce is the next fix.
- Set the confirmation rule. No finding reaches a work order without a named reviewer and a timestamp on the record, and no reviewed finding is ever re-scored by a migration.
- Lock the export and set the longest clock. One system-generated record per finding - image, structure, view, class, severity rationale, reviewer, timestamp - with a hash, in the format your EAM and GIS accept. Retain it for the longest clock any regulator, federal program, insurer or warranty clause can start.
- Trend one corridor and write two numbers into the next contract. Run a cycle-over-cycle comparison on the highest-consequence corridor you already have two cycles for. Then put two numbers, reported per cycle, into the next inspection contract as acceptance terms: confirmed-finding share and record completeness (fields present per finding).
The bottom line
Eight entries turn a photo into something more: a structure, a view, a grade, a class, a severity with a reason, a reviewer's name, a direction of change and an export that will still open in ten years. AI visual predictive maintenance for power grid assets is that record, kept on every structure, cycle after cycle; no model guesses a date from a single frame. The same record pays for itself the first time a regulator, an insurer, a FEMA reviewer or an EPC asks to see it. Build it to the strictest field set once, and every audience gets its answer from the same file.
DetectOS reads the imagery you already collect - drone, helicopter, truck or smartphone - and keeps one expert-verified record per structure across every inspection. The AI carries the volume, and a person stands behind every finding.
See which of the eight entries your imagery already carries
Send us a recent inspection - drone, helicopter, truck or smartphone. DetectOS will tie each frame to its structure, grade it, run analysis with expert review against a 258-type catalog, and show you which Ledger entries your current record is missing - on your own structures.
Book a free audit →Frequently asked questions
What makes it hard for utilities to predict failures from asset photos?
How do AI asset inspection platforms reduce unexpected outages on power grids?
Top AI tools converting utility visual data into predictive maintenance insights?
Which predictive maintenance platforms analyze visual data for grid assets?
What is AI visual predictive maintenance for power grid assets?
What can a hash, a timestamp and a reviewer each prove about an inspection photo?
How does comparing this cycle's image against last cycle's reveal a developing failure?
How long must utilities keep inspection photos and work orders?
How do utilities document storm damage for FEMA reimbursement?
Does AI asset inspection replace field inspectors?
Can photos show internal decay, rot or hairline cracks?
Can thermal or infrared images predict transformer or connector failure?
Figures cited from the Detect Data Quality Program asset-owner report, Detect, State of Utility Drone Inspections 2026, and the Detect CompassData 345kV case study; external sources are named and dated inline.
