
Choosing Predictive Intelligence Software for Utilities
Most predictive intelligence software is bought on a demo built from the vendor’s best imagery. Here is how utility asset and operations leaders can buy it on proof instead - your imagery, an answer key only you hold, and contract terms that pay for findings you can use.
Predictive intelligence software converts asset condition data - for most of the overhead grid, inspection imagery - into ranked, forward-looking maintenance decisions. Choose it on proof, not a demo: give finalists past-cycle imagery, score their findings against outcomes your engineers already know, and buy the record that holds up in your EAM.
- Test before you buy. The Known-Outcome Test scores each finalist on your own past-cycle imagery, against structures your engineers have since graded, repaired or seen fail.
- Give every seat on the committee its own test. Asset management scores the ranking, engineering scores accuracy per failure class, IT and GIS run an import and security review, and procurement prices usable findings.
- Regulators already ask for ranked risk. California’s investor-owned utilities must “assess and rank risks and mitigations” in rate filings (CPUC D.22-12-027), and FERC accepted ISO New England’s Asset Condition Reviewer role in October 2026.
- The model is one layer of eight. Catalog, capture standard, structure association, expert review, history, delivery and security decide whether a build, a toolkit or a purchase will work.
- Prove it on new construction first. Inside the warranty window the contractor pays for the fixes: on one new 345kV line, 13,004 Critical and High-priority defects were fixed at the EPC’s cost (Detect x CompassData case study, 2026).
- What is predictive intelligence software for utilities?
- What is the best predictive intelligence software for power grid assets?
- How should enterprise utilities compare AI predictive intelligence software for grid reliability?
- How do you test a vendor’s predictions before you buy?
- Should you build, assemble or buy predictive intelligence software?
- Which questions should a predictive intelligence RFP ask?
- Where should a utility prove predictive intelligence first?
- How do you choose predictive intelligence software, step by step?
- The bottom line
- Frequently asked questions
What is predictive intelligence software for utilities?
Predictive intelligence software converts asset condition data into ranked, forward-looking maintenance decisions rather than raw detections. In practice it owes you four things for every structure: graded findings, a risk ranking that weighs severity against consequence, a history that shows how condition is changing, and an action window your planners can schedule against.
The data it reads depends on the asset. Power grid monitoring and asset performance management (APM) platforms watch instrumented equipment - substation transformers, breakers - through sensors and SCADA. Most of the overhead network has no sensors at all: poles, lattice towers, crossarms, insulators and the hardware that holds them together. For those structures the condition record is built from inspection imagery, which is why predictive maintenance for power grid assets starts with the photo.
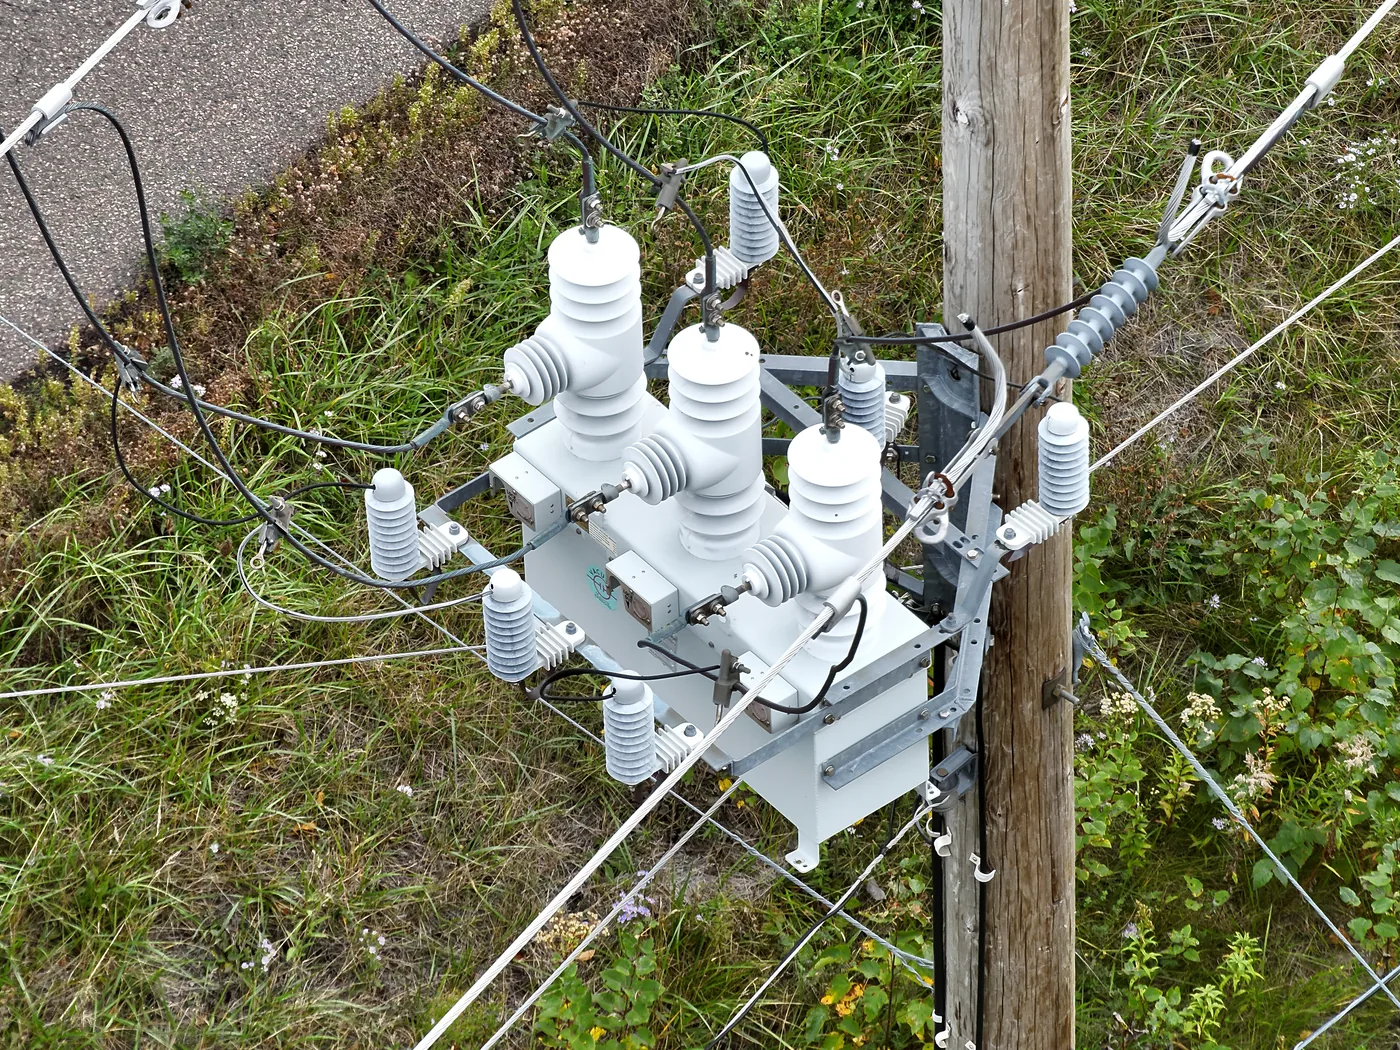
Nothing on this distribution pole reports its own condition. Insulators, bushings, brackets and guy hardware are graded from the image or not at all.
Which category answers which question - APM for instrumented equipment, the EAM as the system of record, visual-data platforms for everything that cannot report its own health - is mapped in our comparison of predictive maintenance platforms. This guide picks up where that one stops: how to choose within the imagery-driven category, and how to make a vendor prove it.
What is the best predictive intelligence software for power grid assets?
The best predictive intelligence software for power grid assets is the one that finds what your engineers already know is there - on your imagery, scored against your outcomes. No published ranking, ours included, can settle that for your network, because accuracy and ranking quality depend on your structure types, your capture sources and your systems.
What you can settle in advance is which kind of software to test. For instrumented substation equipment, that is usually an APM platform fed by sensors. For the overhead network, it is software that reads condition from inspection imagery, puts a qualified reviewer on its findings, ranks them by risk and delivers structure-level records your enterprise asset management (EAM) system can use. The capabilities that separate those platforms - per-structure records, risk ranking, expert validation, systems output, audit trail - are what turns findings into risk-based utility work plans.
DetectOS is built for the overhead network. It takes drone, truck-mounted and handheld imagery - phone photos included - grades it against a 258-type, 19-class defect catalog, and puts utility inspection experts on every AI finding before it reaches a planner: the Hybrid AI + Expert Review model. Delivered findings are 95%+ accurate across all main failure classes (measured as F1 0.95+, AI detection plus expert review) and arrive as structure-level records within two business days of upload.
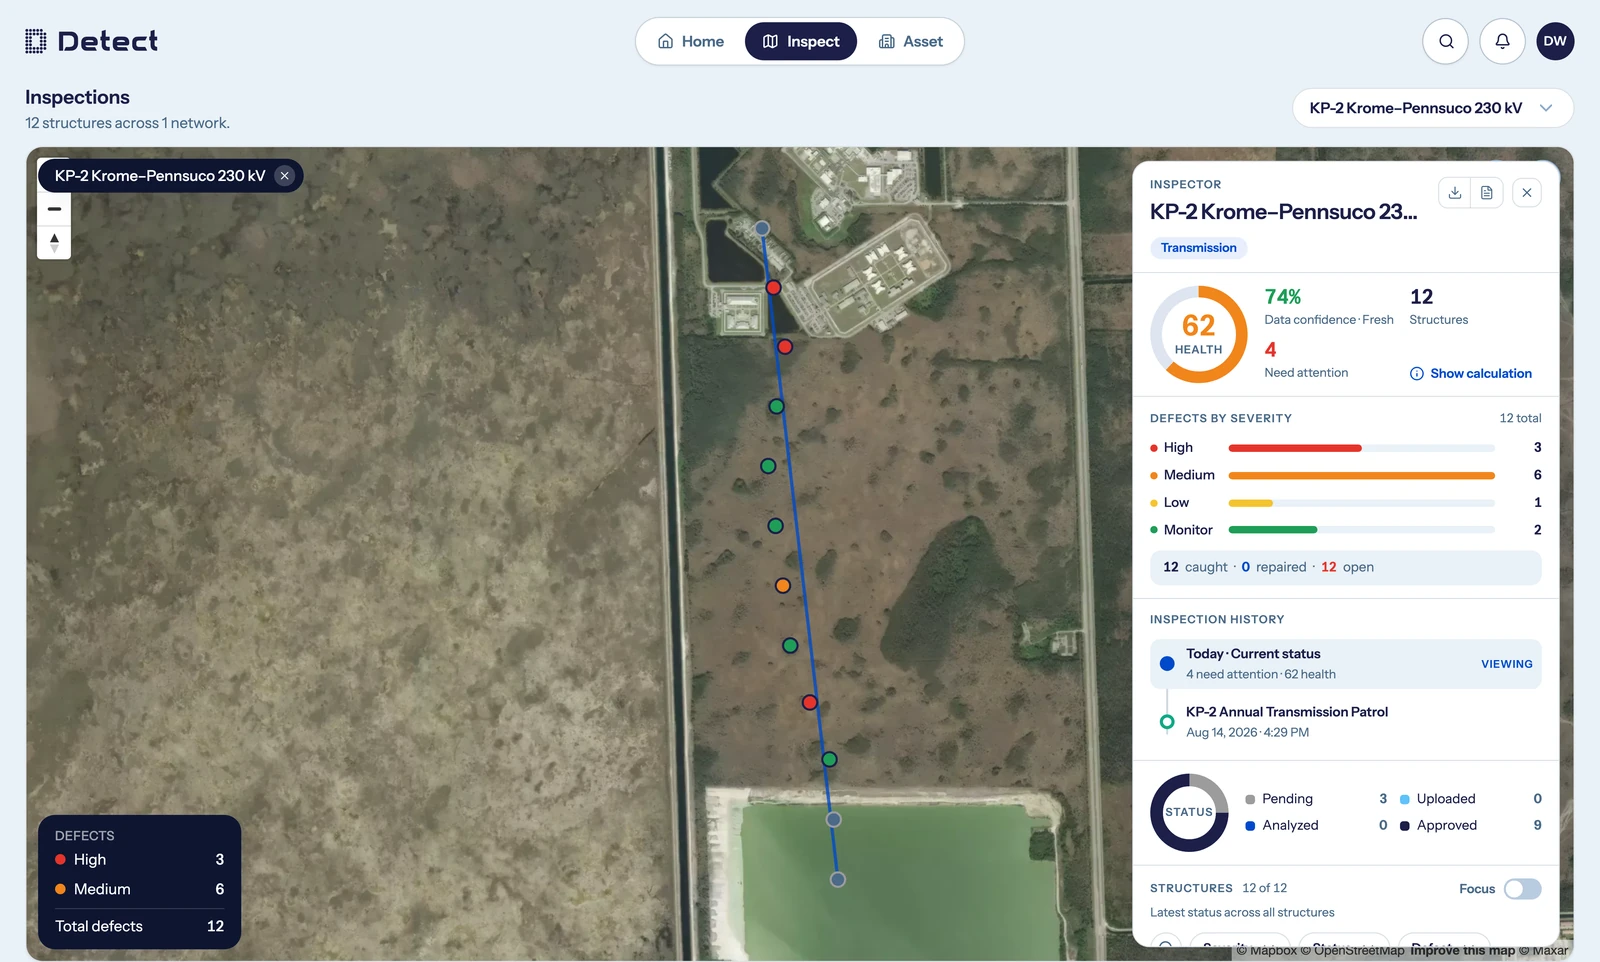
The evidence a pilot scores: one line’s health score beside its data confidence, severity counts and inspection history. DetectOS, shown with demo data.
Hold every finalist, Detect included, to the two tests that follow.
How should enterprise utilities compare AI predictive intelligence software for grid reliability?
Compare candidates on evidence from your own network, and give each seat on the buying committee the test that answers its question. Grid reliability improves only when the right structure reaches the right crew in time, so the comparison has to cover the ranking, the record and the delivery - not just detection.
The ranking will be read outside the utility, too. California’s investor-owned utilities must use the CPUC’s Risk-Based Decision-Making Framework to “assess and rank risks and mitigations” in their risk and rate case filings (CPUC Decision 22-12-027, 2022), with risk scored as likelihood times consequence; the CPUC lists failure of electric distribution overhead assets among the risks utilities have addressed in those filings (CPUC RDF fact sheet, 2024). In New England, FERC accepted the ISO’s Asset Condition Reviewer role in October 2026, an advisory role that includes reporting on how transmission owners monitor and evaluate asset condition (ISO New England, 2026). Either way, the ranking has to be explainable to someone outside the building.
| Seat at the table | The question it owns | Evidence that answers it |
|---|---|---|
| Asset management | Does the ranking match condition and consequence? | Where known critical structures land in the vendor’s ranked list |
| Operations and reliability | Will findings arrive in time to schedule work? | Turnaround in business days from upload, measured in the pilot |
| Engineering and standards | Do severity calls match engineering judgment? | Accuracy per failure class after expert review, and the written severity rubric |
| GIS, IT and OT security | Will records land in our systems without new risk? | An EAM and GIS import test, the SOC 2 Type II report, role-based access and audit logs |
| Regulatory and compliance | Will the record hold up in a rate case, wildfire plan or audit? | Dated, image-linked findings with reviewer history |
| Procurement and finance | Does the price track usable output? | Cost per usable finding, data rights and exit terms |
| Field crews and contractors | Can we find and fix the structure? | Structure ID, location, component, photo and severity on every finding |
Expect the delivery tests to matter as much as the detection ones. In an April 2026 Deloitte survey of 60 investor-owned utility executives, only 10% reported both high geospatial and high AI maturity, and among those without an integrated geospatial architecture, 53% named data silos as a top-three barrier (Deloitte Insights, 2026). If you need weights to break a tie between finalists, the grid inspection AI scorecard assigns them across seven criteria. Apply the weights after the evidence is in, not instead of it.
How do you test a vendor’s predictions before you buy?
Run a Known-Outcome Test: give every finalist the same imagery from a past inspection cycle, and score what comes back against what your utility already knows happened to those structures. It is the one test of a predictive claim you can run before signing, because the outcomes are already in.
Your engineers hold the answer key - structures since repaired, replaced or reclassified, and any that failed - and no vendor sees it. A demo shows a vendor’s best imagery and best catches. The answer key shows how the software performs on your structure types, your capture sources and your crews’ photos.
How do you run a Known-Outcome Test?
- Pick a slice that mirrors your network. One transmission line and one distribution circuit, mixed structure ages and capture sources, from an inspection old enough that outcomes have had time to happen.
- Seal the answer key. List the structures your engineers have since graded, repaired or replaced, and any that failed. Keep it out of every vendor’s hands.
- Send identical files. The same imagery to every finalist, in the formats your crews and contractors actually produce, with no hints.
- Ask for the deliverable. Verified findings per structure, a ranked list, and records in the format your EAM and GIS ingest.
- Score four measures against the key, using pass bars you wrote down before the first image shipped.
What does a Known-Outcome Test score?
- Accuracy by failure class. Precision (what is flagged is real) and recall (what is real gets flagged) for each main failure class, combined as F1. One blended figure can hide misses on the classes that drive your outages: a 2025 survey of published power-line inspection research lists detection scores as high as 99.5% for insulator self-explosion and as low as 54% for pin defects on bolts (arXiv survey, February 2025).
- The top of the list. Where your known critical structures land in the ranking, and whether any fall below the slice your crews could reach next quarter. Ask how the score is built: on one 345kV build, DetectOS multiplied defect severity by component criticality on a 0-25 scale and finished triage before engineering review began (Detect x CompassData case study, 2026).
- The record. Every finding tied to a structure ID, a component, an image and a named reviewer, with a report of which frames could not be graded.
- The delivery. Records loaded into your EAM and GIS test environment without re-keying, on a turnaround stated in business days. The checks we use to verify AI inspection results apply to pilot output line for line.
These four sit alongside the pipeline numbers any utility AI inspection pilot should report: assessable share, verified-finding rate and capture-to-decision time. The answer key is what turns those numbers into a test of prediction.
0.15% of findings were critical. On one new 345kV line, AI screening and expert review turned 65,701 images into 45,335 findings across 927 structures - and 67 of them were critical. Triage is the product. Source: Detect x CompassData 345kV case study, 2026.
What pass bar should a predictive intelligence pilot meet?
Write the bars down before the first image ships, with the people who will use the output. A workable set: an accuracy floor for each main failure class, measured after review; every known critical structure inside the slice you could crew next; every finding linked to a structure and an image; records accepted by your EAM test environment; and turnaround in business days. Then add the bar that is specific to prediction: where a structure has two comparable inspection cycles, the change the software reports should match the change your engineers see.
Cadence limits any forecast. Reliability-centered maintenance practice holds that an inspection interval must be “the same as or shorter than the P-F interval” - the time between a detectable problem and a functional failure (U.S. DoD RCM manual). California’s General Order 165 sets detailed inspections of overhead distribution facilities on a five-year cycle (CPUC GO 165). Software can only forecast between the inspections you actually run.
Should you build, assemble or buy predictive intelligence software?
Build if you have a data science team, years of labeled imagery and a review bench you can staff. Assemble from a computer vision toolkit if you have the engineers but not the defect catalog. Buy if you need verified findings this inspection cycle. Whichever you choose, the detection model is one layer of eight.
The data-platform tutorials that rank for this topic show the plumbing well: load the data, score the risk, chart it. What a tutorial cannot ship is the part your structures need - a labeled defect catalog, verified detections on your own imagery, and the people who sign them off. Public training data is scarce: EPRI released about 30,000 drone images of overhead distribution infrastructure because, in its words, there is “an industry gap for publicly available electric utility infrastructure imagery” (EPRI on IEEE DataPort, 2021).
Building at utility scale takes years and a standing team. San Diego Gas & Electric’s rate case workpapers describe 60+ asset identification and damage detection models in use by the end of 2022 to QA/QC drone inspections performed by qualified inspectors, alongside a central image repository where those inspectors give the models feedback (SDG&E workpapers, CPUC A.22-05-016, April 2026).
There is a middle path: keep your data platform as the place where analysis happens, buy the imagery layer, and join its verified records with the outage, load and sensor data you already hold.
Which questions should a predictive intelligence RFP ask?
Ask questions only evidence can answer, and settle the commercial ones in writing early: what the software can honestly predict, how it will be scored, who owns the data, how price tracks usable output, and what you get back if you leave. The data clauses - capture standard, acceptance gate, one defect catalog, documented expert review, business-day turnaround - are already written out in our Usable-Data Spec for inspection RFPs, and capability questions are covered by the seven evaluation questions we publish for any vendor, including us. The ten below cover the rest.
| Ask | A strong answer | A red flag |
|---|---|---|
| What can you predict from one inspection, and what needs two? | One cycle gives graded condition and an action tier per finding; degradation trends need comparable cycles | Remaining-life estimates from a single photo |
| Will you be scored against a sealed answer key on our imagery? | Yes, with pass bars agreed before the pilot starts | Only a demo on the vendor’s own data |
| What is your accuracy per failure class, model-only or after review? | Precision, recall and F1 per class, after expert review, on comparable utility imagery | One blended accuracy figure |
| How is the risk score built? | Severity weighed against component criticality on a written rubric your engineers can audit | A score nobody can explain |
| Who owns the imagery, the findings and anything trained on them? | You own your imagery and records, and any use for model training is stated in the contract | Silence on training use |
| How does price track usable output? | Cost per usable finding, with unassessable imagery reported up front | A rate per structure with no view of how much imagery could be graded |
| What do we get back if we leave? | Bulk export of images, findings and history in open formats, on a stated timeline | Export “on request” |
| What do you need from our EAM and GIS, and who builds the connection? | A defined record format, an import test in your environment, integration scope in writing | “We integrate with everything” |
| What security evidence will you share? | A current SOC 2 Type II report, role-based access and audit logs | Policies described, no report |
| What turnaround will you commit to, and what counts as delivered? | Business days from upload to reviewed findings, written into the terms | “Real-time,” undefined |
Then write the answers into the contract: ownership and export of imagery and records, accuracy reported per failure class on a schedule, turnaround in business days from upload, a per-finding audit trail, the current SOC 2 Type II report, integration scope, and pricing expressed as cost per usable finding - what you paid divided by what you could act on. What each record must carry to land cleanly in Maximo, SAP or Esri environments is set out in the Asset-Record Contract. Detect holds SOC 2 Type II attestation; ask every finalist for the report itself.
Where should a utility prove predictive intelligence first?
On new construction, inside the warranty window. The commissioning inspection is cycle zero of the condition record: the fixes it finds are the contractor’s to pay for, the outcomes arrive quickly, and it sets the baseline every later forecast is measured against.
One 345kV build shows the economics. Drone imagery of 927 structures became 45,335 findings through AI screening and expert review; 67 were critical, and every one was caught inside warranty. The operator received an image-linked defect register within 72 hours of the last flight - structure, component and annotated image for every finding, the documentation a warranty claim needs. In all, 13,004 Critical and High-priority defects were fixed at the EPC contractor’s cost. Found at the first scheduled cycle three to five years later, they would have been the utility’s to fix at O&M rates (Detect x CompassData 345kV case study, 2026).
The same dataset kept working after closeout. 22,445 “good-to-know” findings became the as-built starting condition for every structure, so the next inspection measures change instead of building a baseline from scratch. That is why the record from a new 345kV transmission line is where a forecast begins.
A warranty audit asks more of the software than a routine patrol. Each finding has to be traceable enough to compel a contractor that has already demobilized, ranked so engineering starts where the risk is, and delivered while the warranty is open. Those are the properties a predictive program needs anyway, which makes construction QA the cleanest place to prove one.
On lines already in service, start where consequence is highest - wildfire-exposure areas, circuits that carry critical load, the oldest structures - and run the Known-Outcome Test there. The first cycle sets the baseline. The second starts the trend.
How do you choose predictive intelligence software, step by step?
Seven steps, in this order. Each one narrows the field with evidence the next step needs.
- Map assets by data path. Separate equipment that reports its own health through sensors from structures that can only be photographed.
- Name the decision you want to change. For example: which structures get a crew next quarter, and in what order.
- Shortlist by category. Use the four-axis Risk Insight Test to drop tools built for the wrong slice of the grid.
- Send the RFP questions. Ask what the software can predict, how it will be scored, who owns the data and what you get back if you leave.
- Run the Known-Outcome Test. Past-cycle imagery, a sealed answer key and pass bars agreed in advance.
- Score and price the finalists. Weight the evidence with a scorecard, then compare cost per usable finding and exit terms.
- Start where the record pays fastest. New construction inside the warranty window, or your highest-consequence circuits.
The bottom line
Predictive intelligence software earns its place when it changes which structure gets a crew next, and when. Qualify it the way you would any instrument: test it against known values before you trust its readings. For the overhead grid, that means imagery from your own lines, an answer key only your engineers hold, and records that land in your EAM without re-keying. It is the standard DetectOS is built to meet as predictive grid intelligence software: decision-grade grid intelligence from every image, across your entire network.
Score us against what you already know
Walk through DetectOS with your own lines in mind - or send one line’s worth of past-cycle imagery, and check our risk-ranked, expert-verified findings against what your engineers already know.
Book a demo →or start with a free analysis of one segment