
AI Defect Severity Scoring and Asset Health Indexes: How Utilities Standardize Condition Ratings
A severity label on one photo is easy. A condition rating that engineers, contractors and regulators read the same way in every region is not. Here is how AI severity scoring, structure condition, health scores and data confidence fit together - and what to ask any vendor before you trust them.
AI defect severity scoring rates each finding on an inspection image - typically High, Medium or Low - by its consequence, using written criteria for the defect and component. Ratings become standard when every contractor and region uses one defect catalog, one rubric and expert review. An asset health index then rolls verified findings up per structure.
DetectOS keeps all of it on one structure record: severity on every finding, a condition label, a 0-100 health score with its calculation one click away, and a data-confidence figure - with an inspection expert confirming every finding before it counts.
- Severity is about consequence, not model confidence. A backed-off nut on a load-bearing clamp outranks surface rust on a plate, however sure the model is about either.
- Standardization lives in the catalog and the rubric. One defect catalog - Detect's covers 258 defect types across 19 classes - and written criteria per class are what make a High mean the same thing in every region.
- Human ratings drift without a standard. In the Federal Highway Administration's study of visual bridge inspection, only 68% of condition ratings were predicted to fall within one point of the average (FHWA, 2001).
- A health score needs a confidence figure beside it. Blurry imagery leaves roughly 18 of 258 defect types assessable, so a clean score on that evidence means unknown, not healthy.
- The top of the scale is rare by design. On a new 345kV line, 67 of 45,335 findings were critical - 0.15% (Detect CompassData 345kV case study).
- Map AI severity into the priority scheme you already answer to, such as California's GO 95 Rule 18 levels, instead of adopting a vendor's scale.
What is AI defect severity scoring?
AI defect severity scoring is the step that turns a detection into a priority. The model finds and classifies a defect on the image - a loose fitting, a missing cotter key, a cracked insulator shell - and the finding is rated on a fixed scale, usually High, Medium and Low, by what it means for safety and reliability if it is left alone.
The rating comes from written criteria, not from the model's confidence. The criteria name the defect class, the component it sits on, how far along it is and how critical that component is. In Detect's process the severity sits on the finding with its rationale, and an inspection expert confirms, edits or rejects it in the review workspace before it reaches your engineers. Severity is entry five of the eight entries every inspection photo collects on its way to becoming a record.
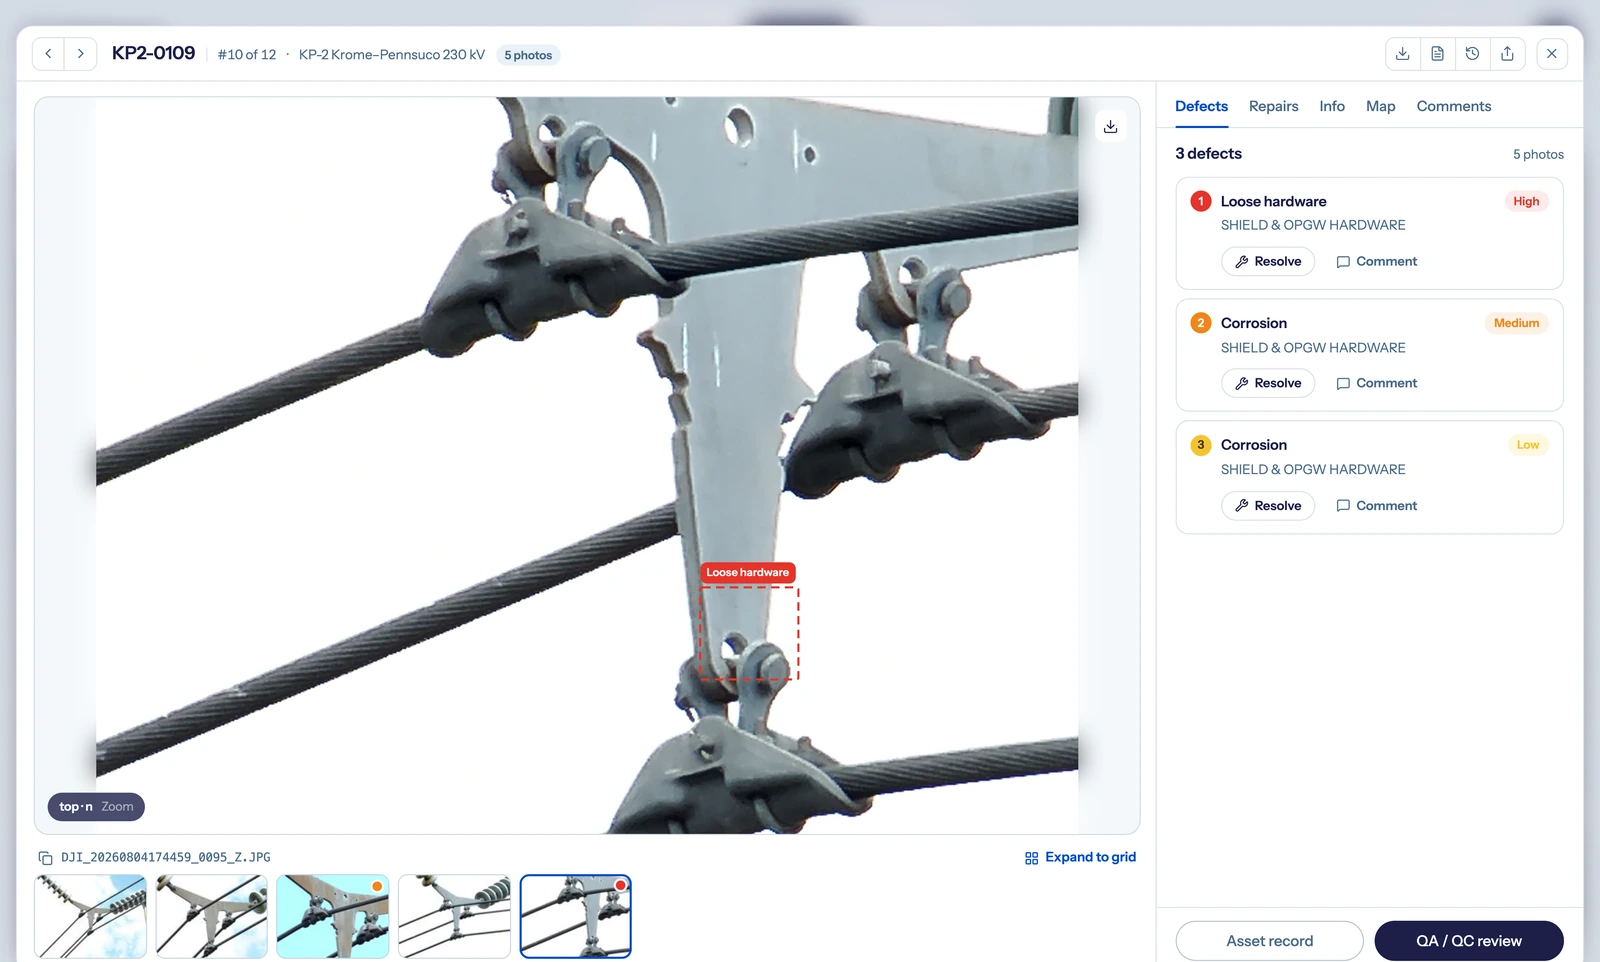
Severity on the finding: three defects on one structure, each with a defect class, a component class and a High, Medium or Low rating, ahead of QA/QC review. Detect · demo environment
How is severity different from model confidence?
Model confidence says how sure the model is that it saw something. Severity says what it means if it is real. The two move independently: a model can be very sure about light surface rust, which is Low, and less sure about a missing cotter key on a load-bearing clevis, which is High until a person says otherwise. A tool that ranks its queue by confidence puts the wrong findings at the top.
What does a severity rubric look like?
A rubric is a short table per defect class that says what moves a finding from Low to High. The thresholds belong to your engineering standards; the shape below is common across utility programs.
| Severity | What it means | Illustrative findings | Typical response |
|---|---|---|---|
| High | Could cause a failure, outage or safety event before the next inspection cycle | Missing cotter key on a load-bearing clevis; broken insulator shell; loose hardware on a shield-wire clamp | Route to the priority level with the shortest corrective window |
| Medium | Degrading; needs planned work | Corrosion with visible section loss; a loose fitting on a non-load-bearing attachment | Schedule into the work plan |
| Low | Note and monitor | Surface rust without section loss; cosmetic damage | Re-check next cycle and compare |
Examples are illustrative, drawn from defect classes in Detect's catalog. Your engineers set the criteria.
What is the difference between severity, criticality and risk?
Severity describes the condition of the finding. Criticality describes how much the component or structure matters - a load-bearing clamp on a 230 kV tie line matters more than a sign bracket. Risk combines both with consequence: customers served, fire exposure, what fails next. Severity comes from the image; criticality and consequence come from your asset and network data. A rating you can audit keeps the three separate.
How do utilities standardize condition ratings from images?
By fixing the three things that usually vary between contractors and regions: the defect catalog (what can be called), the severity rubric (how each call is rated) and the review step (who confirms it). When every crew rates against the same catalog and rubric, and an expert signs every finding, a High in one district means what it means in the next.
Without that, ratings drift. The Federal Highway Administration's study of visual bridge inspection found that ratings for the same structures spread over up to five levels, and predicted that only 68% of condition ratings fall within one point of the average and 95% within two (FHWA, Reliability of Visual Inspection for Highway Bridges, 2001). Utility programs that mix contractors, legacy code lists and inspectors of different backgrounds inherit the same spread - and a model trained on inconsistent labels learns the inconsistency.
How do you govern defect codes across regions and contractors?
Treat the defect catalog like a controlled document. One owner maintains it. Contractors and regions rate against it and never add codes on their own. Legacy codes are mapped to it once, and the mapping is kept for audits. Every finding carries both the catalog code and the component class it sits on. Detect's catalog covers 258 defect types across 19 classes, which is what lets a finding from a drone crew in one region sit beside a finding from truck-mounted capture in another and mean the same thing.
- The code list, with a plain-language definition for each defect type
- The component classes each code can attach to
- The severity criteria per code, with photo examples at each level
- A version number, so any rating can say which rubric it used
A rating on the wrong structure is worse than no rating. In Detect's research across utility inspection programs, GPS misassociation - imagery tied to the wrong structure - causes 35% of imagery rework (Detect, State of Utility Drone Inspections 2026). Standardizing ratings starts with standardizing which structure each photo belongs to.
Who should confirm a severity rating?
A person with inspection expertise, on every finding, with their name and decision on the record. Unverified detections move the checking onto your engineers in the busiest weeks. In DetectOS, inspection experts confirm, edit or reject every finding in the review workspace, nothing is auto-approved, and no finding you have signed off on is ever re-scored. Delivered findings reach 95%+ accuracy across all main failure classes - AI detection plus expert review, measured as F1 (0.95+) - within two business days of upload. Whether the severity distribution makes sense is one of the seven checks before trusting AI results.
What is an asset health index, and how does AI feed it?
An asset health index is a single score or band that summarizes a structure's condition so it can be ranked against others for maintenance and replacement. AI image analysis supplies the visual-condition evidence behind it: verified findings, by severity, on each structure. Age, loading, environment and failure history come from your asset systems and complete the picture.
Health indexing is established practice in electricity networks. Great Britain's distribution network operators share one method, the Common Network Asset Indices Methodology: each asset gets a health score on a continuous 0.5 to 10 scale, grouped into five bands from HI1 to HI5, then combined with a criticality band into a monetised risk index (Ofgem, CNAIM v2.1, 2021). Several of its condition inputs are things an inspection photo shows - visual pole condition, pole-top rot, pole leaning, bird and animal damage. One detail matters for image programs: in its observed-condition tables, the default for "no data available" carries the same factor as a component that is fit for continued service. An image-based record can tell those two apart, which is the job of a data-confidence figure.
Detect calls the sequence the rating chain: five links, each traceable to the photo beneath it. In DetectOS the visual side of the index lives on one structure record - a condition label, a health score out of 100 with its calculation one click away, a data-confidence figure, and the open defects counted by severity.

One structure record: condition, a 0-100 health score with its calculation shown, data confidence and open defects by severity. Detect · demo environment
Why does a health score need a data-confidence figure?
Because a score can only be as good as the evidence it was computed from. Detect graded its 258-type defect catalog against capture quality: sharp imagery left 100% of the catalog assessable, soft imagery 69% and blurry imagery 7% (Detect, Data Quality Program report, 2026). On blurry frames a structure can only show defects from roughly 18 types, so a clean score there is absence of evidence, not evidence of health. That is why DetectOS shows data confidence beside every score, and why grey means unknown, never green by default.
Blurry imagery erases 93% of the defect catalog. Of 258 defect types, roughly 18 remain assessable on blurry frames, against all 258 on sharp ones. A health score computed from that imagery is not a low-risk score. It is an unknown one.
Source: Detect, Data Quality Program asset-owner report, 2026.
How does a health index roll up from structure to line to network?
Worst first, with the unknowns kept visible. A line view in DetectOS shows the condition spread across its structures - critical, poor, good and not analyzed - so a line with three critical structures and three not yet analyzed does not read as mostly healthy. The same logic carries up to the network view, where each network's health appears with its own confidence figure.

The same ratings rolled up per line: critical, poor, good and not analyzed, with unanalyzed structures shown as unknown rather than healthy. Detect · demo environment
How should AI severity map to your existing priority codes?
Through a written crosswalk, not a replacement. Utilities already act on a priority scheme with deadlines attached - California's GO 95 Rule 18 levels, or an internal code such as A to F. AI severity should translate into that scheme, so a verified High lands in the level your engineers, crews and regulator already use.
California's rule is the clearest public example. Under GO 95, Rule 18, Level 1 is "an immediate risk of high potential impact to safety or reliability" and calls for corrective action immediately. Level 2 is any other risk of at least moderate potential impact, with a window set by a qualified company representative but no longer than 6 months for a fire risk in Tier 3 of the High Fire-Threat District, 12 months for a fire risk in Tier 2 or a worker-safety issue, and 36 months for everything else. Level 3 is a low potential impact, corrected within 60 months (CPUC General Order 95, 2020 edition).
The deadlines are enforced. In a notice of violation published with its Mosquito Fire settlement, CPUC enforcement staff cited PG&E for correcting three Level 2 conditions on poles in a Tier 3 High Fire-Threat District after the Rule 18 deadline: a woodpecker hole, a loose tie wire and guy-wire insulation. A severity rating that cannot be traced to one of those levels, with a date, leaves the deadline to chance.
| Verified AI severity | Where it usually lands (example) | What your crosswalk must say |
|---|---|---|
| High | Rule 18 Level 1 (immediate) or Level 2 | Which High findings are Level 1, and who on staff makes that call |
| Medium | Rule 18 Level 2: 6, 12 or 36 months, by fire-threat tier and worker safety | The corrective window by defect class and location |
| Low | Rule 18 Level 3: within 60 months, or monitor | When a Low is re-checked, and what change moves it up |
An example crosswalk only. Rule 18 leaves the level to a qualified company representative, and its appendix of examples notes that a facility's location and other site-specific conditions may influence the evaluation.
PG&E's own codes show a crosswalk at work. Level 1 notifications are Priority A tags, and Priority B is the subset of Level 2 that creates a fire risk in Tier 2 and Tier 3 locations, worked within 3 months; on transmission, Priority E is addressed within 12 months and Priority F within 24 (PG&E, transmission procedure TD-8123P-101). The crosswalk also decides where volume sits: at the end of 2023, Priority E and F notifications made up 902,280 of PG&E's 921,117 open notifications - 97% - according to the Cal Advocates protest quoted in the CPUC's 2024 response to PG&E Advice Letter 7167-E. Severity triage is what keeps the few findings that matter from waiting in that queue.
The other direction matters as much. On a new 345kV transmission line, Detect's review returned 45,335 findings across 927 structures; 67 were critical, and 51 of those 67 sat in one segment - a spread that told the owner where to send crews first. On a roughly 250-mile HVDC intertie, 1,270 of 122,714 images were flagged for review, and one of those flags - a clevis bolt missing its cotter key - was cleared in 120 minutes and averted more than $1M in forced-outage revenue (Detect, Data Quality Program report). Clustering verified findings by severity and location is how they become a risk-based work plan an executive can approve.
Which AI inspection tools provide defect severity scoring and asset health indices?
Tools that publish their severity criteria, report accuracy per defect class, put an expert on every finding and show the calculation and data confidence behind any health score. Three categories claim severity scoring: general computer-vision platforms, drone-workflow software with AI add-ons, and utility-specific inspection platforms such as DetectOS, which keeps severity, condition, health and confidence on one structure record.
| Ask any vendor | Why it matters | What good looks like |
|---|---|---|
| Are severity criteria written down, per defect class? | A label without criteria cannot be audited or compared across crews | A rubric you can read, edit and version |
| Is accuracy reported per defect class? | An overall number hides the weak classes | Per-class results on your own imagery |
| Does a person confirm every finding? | Unverified detections move the checking to your engineers | Review by default, a named reviewer, nothing auto-approved |
| Can you see how the health score is calculated? | A black-box score will not survive a rate case or an audit | One click from the score to the findings behind it |
| Is data confidence shown beside every score? | Blurry or stale imagery can look healthy | Unknown shown as unknown, never green by default |
| Is one catalog used across contractors and regions? | Codes drift by vendor and district | A controlled, versioned catalog every crew rates against |
| Do ratings reach your work-management systems? | A rating that stays in a viewer changes nothing | Findings keyed to your asset IDs, ready for your EAM and GIS |
Bring the same seven questions to every vendor, including Detect. The full scorecard for AI grid inspection platforms goes deeper on accuracy, capture quality, integration and security.
Where DetectOS fits. DetectOS, Detect's AI asset inspection software, is built for the utility case: severity on every finding against a 258-type catalog, a condition label and 0-100 health score per structure with the calculation visible, data confidence beside every score, and inspection experts on every finding. It takes imagery from any capture source - drone, helicopter or ground, including truck-mounted cameras - and Detect can run capture end to end through its vetted Partner Network. Findings export keyed to the asset IDs your GIS and EAM already hold, ready to load into ArcGIS, Maximo or SAP; integration is scoped per program.
How do you standardize asset ratings across an enterprise utility?
Start from the codes you already have, converge them on one catalog and one rubric, and make review and data confidence non-negotiable. This order avoids re-rating the same structures twice.
- Inventory every code list in use - by contractor, region and asset type - and the volume of findings under each.
- Adopt one defect catalog and map legacy codes to it once; keep the mapping for audits.
- Write the severity rubric per defect class, with photo examples at each level.
- Crosswalk severity to the priority scheme you file against, with corrective windows.
- Require expert verification and a named reviewer on every finding, in every region.
- Show data confidence beside every rating, and re-rate a sample next cycle to check the rubric holds.
Multi-region programs gain the most. When ratings mean the same thing everywhere, condition can be benchmarked across districts and contractors, capital can be compared line against line, and a regulator sees one standard. Carrying those ratings into work orders is a data-contract question, covered in how to integrate AI inspections with your GIS and EAM.
The bottom line
A severity label, a condition rating and a health score are only as useful as the chain behind them. Fix the catalog and the rubric, put an expert on every finding, show confidence beside every score, and crosswalk the result into the priority scheme you already answer to. Then a High means the same thing on every line, in every region, from every crew - and the few findings that matter reach a crew first.
See your own findings rated against one standard
Walk through DetectOS with your own structures in mind: severity on every finding, condition and health per structure, and the data confidence behind each score.
Book a demo →or start with a free analysis of one segment