
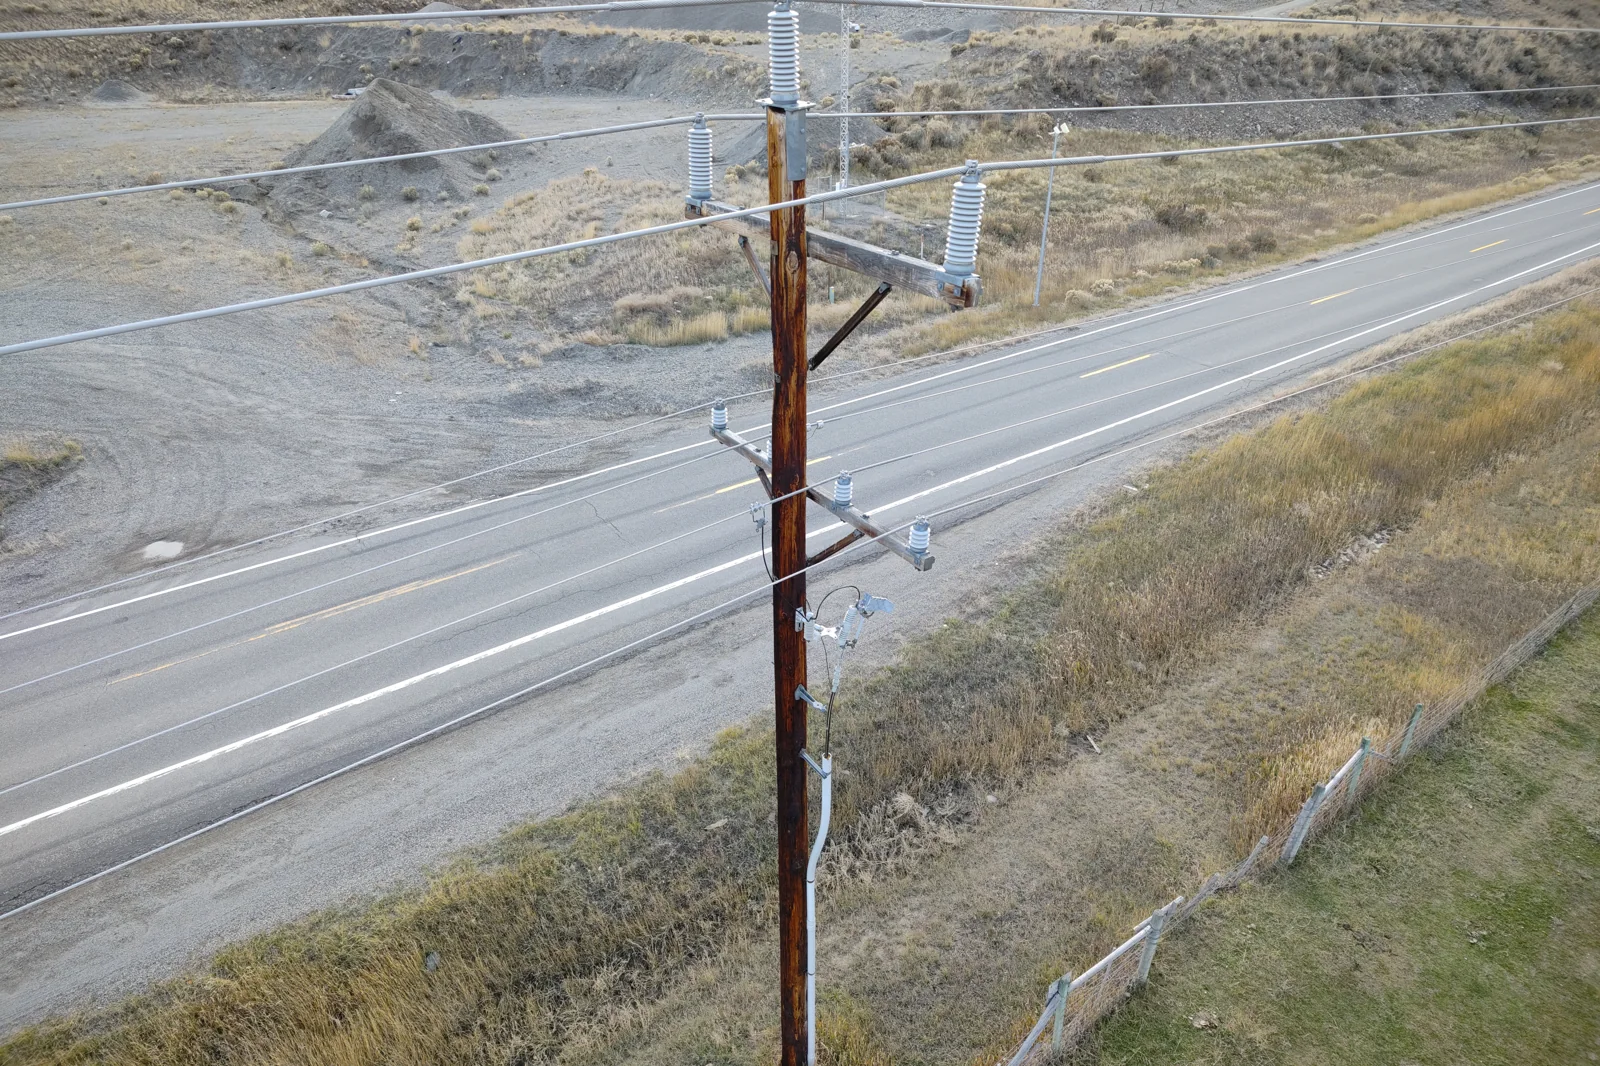
DetectOS is AI visual inspection for power grid assets, applied to the photos a Canadian utility collects after a storm. Imagery from drones, trucks, helicopters, and crews' phones is tied to individual structures, analyzed for damage, severity-ranked, verified by engineers, and exported as a per-structure defect register - so crews are routed on structured visual evidence rather than on a folder of photographs.
- Photos from any source land in one record per structure. A crew's phone shot and a drone frame of the same pole are the same asset, not two files.
- Damage is ranked, not listed. Every finding carries a severity and is reviewed by a person before it reaches a work list. Nothing is auto-approved.
- Unknown reads as unknown. A feeder that has not been photographed yet shows grey, not green - the gaps in the storm picture are as visible as the damage.
- Proven in Canadian conditions. A 618-structure remote transmission audit through muskeg and permafrost delivered its defect register within 72 hours of the last flight, ahead of winter freeze-up.
What storm damage photo triage looks like for a Canadian utility
After an ice storm, a derecho, or a wildfire-season wind event, the imagery arrives faster than anyone can read it. Line crews photograph what they find. Contractors fly corridors. A helicopter patrol returns hundreds of frames from 300 feet. Somewhere in that pile are the broken crossarms, the leaning poles, the cracked insulators, and the hardware that will fail on the next cold night - and the question operations leaders actually need answered is not "what did we photograph?" but "which structure needs a crew first?"
Traditional electric utility inspection was never built for that moment. Images sit in folders named after flights or trucks. A photo of the wrong pole is indistinguishable from a photo of the right one. The people who can judge severity are the same people trying to restore service. The result is a triage that runs on memory and phone calls while the evidence sits unread.
How DetectOS triages storm damage photos
DetectOS is built around the asset, not the job. Every image that enters the platform is associated to a structure and carries its own processing record, so "where did my images go?" no longer needs an engineer. The photo-based defect detection that follows is the same analysis Detect runs on routine inspection campaigns, reviewed by people before anything is signed off.
Ingest from any source. Image processing is configuration, not code: the pipeline resolves a profile from the capture source and ingestion channel, then runs the same ordered stages - associate to a structure, classify the shot, store, analyze. A crew's phone, a truck-mounted rig, and a contractor's drone are profiles, not integrations. Uploads are chunked and resumable, so a dropped connection in the field does not lose the batch.
Associate every photo to one structure. This is the step that makes storm imagery usable. A frame tied to structure 4471 joins that structure's history - the pre-storm condition, the post-storm damage, and the repair that follows - rather than living in a folder named after the day it was taken. Utility infrastructure monitoring across a storm season depends on that record staying whole.
Detect, rank, verify. AI image analysis finds the damage and assigns a severity. Engineers review the findings on the image before they are released. Every health score carries a data-confidence figure beside it, so a structure with two blurry frames is not scored as if it had twelve sharp ones.
Route on evidence. The output is a defect register per structure - exportable as CSV with the columns your team picks, per network or per structure, for today or for any past inspection. Crews are dispatched to a ranked list of confirmed damage with the photograph attached, and the same register becomes the evidence file for warranty claims, mutual-aid coordination, and regulator questions later.
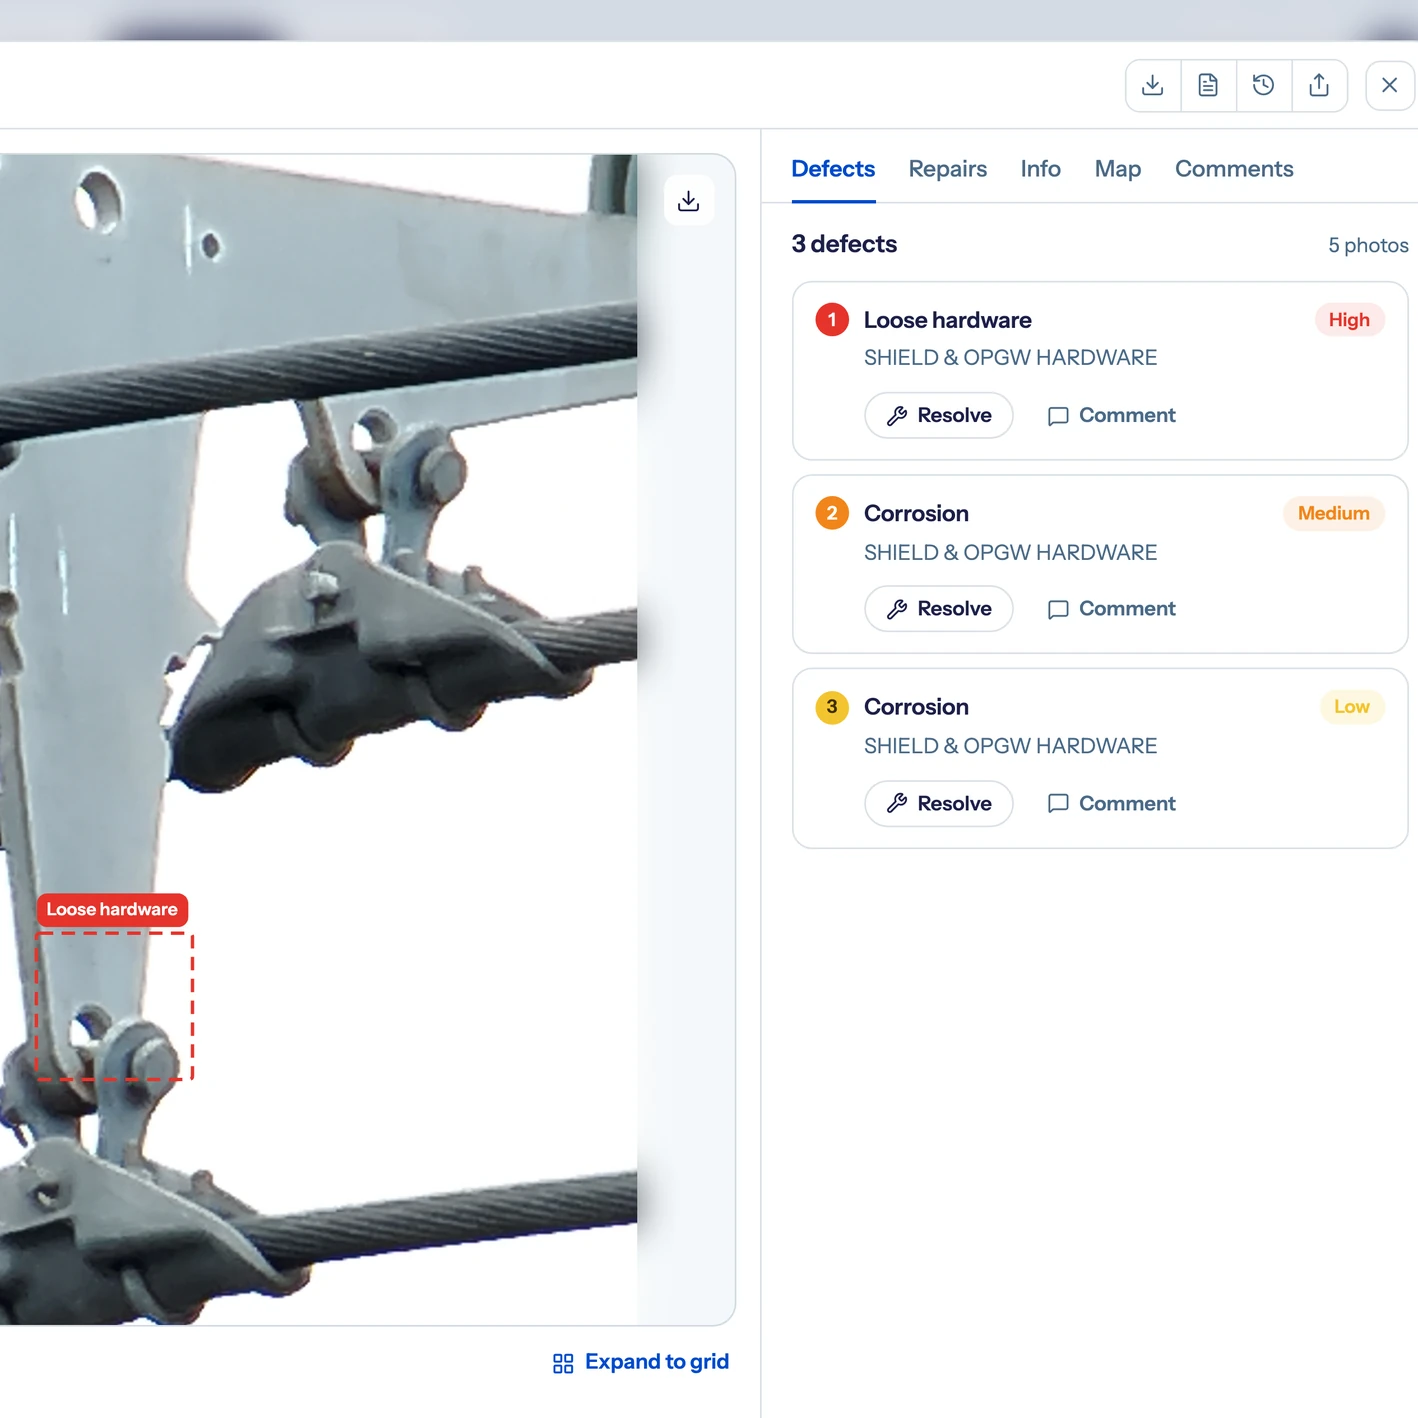
A finding as a crew receives it: the structure, the defect on the image, the severity, and the location - reviewed and signed off before it leaves the platform.
Why AI visual inspection for power grid assets has to work in Canadian conditions
The storms that test a Canadian power grid arrive with cold, ice, and distance attached. Ice loading changes what a camera can see on a structure. Winter light shortens the capture window. The lines that matter most after an event are often the ones through muskeg, permafrost, and boreal forest that ground crews cannot reach quickly - the same corridors where a second mobilization costs the most. Detect's platform is sensor-agnostic by design, and its capture standard grades sharpness at ingest: in Detect's Data Quality Program analysis, sharp imagery keeps 100% of a 258-type defect catalog assessable, soft imagery 69%, blurry imagery 7%. After a storm, that grade tells an operations leader which structures have been assessed and which have only been photographed.
The regulatory and investment context points the same way. Hydro Ottawa closed 2025 with its largest-ever distribution capital program, close to $190 million aimed at aging infrastructure and reliability (Hydro Ottawa, 2026). NERC's review of Canadian wildfire mitigation documents utilities moving from deterministic rules to probabilistic, data-driven risk management, naming AI and aerial monitoring among the tools making the shift possible (NERC, Wildfire Mitigation - Canadian Perspectives). Both require the thing a storm makes hardest to keep: a consistent, structure-level visual record. What Canadian utilities should add to any platform shortlist - capture quality proven in cold and low light, risk models tuned for wildfire and ice - is laid out in the guide to evaluating AI grid inspection platforms; how the same record feeds forecasting is in visual predictive maintenance for grid assets.
Field proof from the programs Detect has run
Two newly commissioned lines serving 17 communities - 618 lattice structures through lakes, muskeg, and permafrost - had to be documented before construction warranties expired and winter set in. Helicopter flybys had spotted leaning towers and flooded footings but could not produce claim-ready evidence. Two UAV operators with helicopter support covered 100% of the structures in nine field days, with nightly AI-assisted triage; DetectOS delivered a structured defect register within 72 hours of the last flight, and the utility filed its warranty claims before the deadline. Read the case.
On a separate program - a roughly 250-mile HVDC intertie of about 2,600 lattice towers, in its first season after commissioning - a three-person team worked a campaign that flagged 1,270 items. One of them, a clevis bolt with its cotter key missing, was cleared in 120 minutes of field time, averting more than $1M in forced-outage revenue (Detect Data Quality Program asset-owner report). Read the case.
Neither was a storm. Both are the mechanics a storm demands: imagery from wherever it can be captured, tied to structures, ranked by severity, verified by people, and turned into a list crews can act on - with the speed coming from the pipeline, not from a promise. Where power grid asset inspection already runs on that record, the post-storm triage is the same workflow at a different tempo.
Where to start
Send Detect a recent inspection set - a routine campaign or last season's storm folder. The free audit tags each image to a structure, grades assessability and association, and returns a severity-ranked register, so you can see what your current process is letting through before the next event.
See your storm folder as a work list
Book a free audit and get a structure-level, expert-verified defect register from imagery you already have.
Book a free audit →