
Asset performance management and the predictive maintenance tipping point
The economics of grid infrastructure management show a cost gap between reactive and predictive maintenance strategies so wide that the ROI debate is effectively over.
- Predictive maintenance reduces unplanned downtime by up to 75%, cuts maintenance costs by up to 30%, and extends equipment lifespan 20-40% beyond preventive programs alone.
- AI-driven fault detection has flipped the risk equation. At 85-95% accuracy with false alarms cut by 50%, deploying AI inspection is now lower-risk than continuing without it.
- Predictive maintenance for grid assets is projected to grow from $10.8B in 2025 to $57.7B by 2035, capital allocated by organizations that have already run the numbers.
- The workforce shortage is a forcing function, not a headwind: 76% of grid-sector employers report difficulty filling roles, climbing to 89% in transmission, distribution, and storage.
- Utilities are moving to outcome-based contracts tied to asset uptime, which rewards contractors and DSPs with auditable, data-backed inspection intelligence—and punishes those running on spreadsheets. Start with high-criticality assets and clean data infrastructure, not a bolt-on AI tool.
- Unplanned failures cost far, far more scheduled maintenance
- AI-driven fault detection has reached accuracy levels that flip the risk equation
- The asset performance management market is pricing this in. Your competitors are too.
- The workforce shortage is a forcing function
- How organizations are responding
- The contract model is shifting under everyone's feet
- Where to start with predictive asset management (and what to skip)
What remains is an adoption gap, and it's closing faster than the organizations still running time-based inspection cycles seem to realize.
This is a look at the numbers driving that shift, what they mean for contractors and DSPs operating in the field, and where the sharpest organizations are placing their bets.
Unplanned failures cost far, far more scheduled maintenance
A few stats that show the reality of where the industry is at:
- Unplanned failures cost 4 to 5 times more to repair than scheduled maintenance.
- Emergency repairs run 3-5x more expensive than planned work.
- Equipment without a structured predictive maintenance program fails significantly sooner than equipment on a condition-based program.
The gap widens when you compare the three dominant maintenance strategies side by side.
Reactive (break-fix)
Highest total cost with the shortest equipment lifespan and no downtime reduction. You're paying premium rates for emergency mobilization and parts expediting on assets that gave you warning signs months earlier.
Preventive (scheduled)
Moderate cost which extends equipment lifespan by 20-30% and delivers moderate downtime reduction. Better than reactive, but you're still servicing assets on a calendar rather than on condition, which means you're touching healthy equipment and missing degradation between cycles.
Predictive (condition-based)
Not only is this the lowest long-term cost, but preventative maintenance extends equipment lifespan by an additional 20-40% beyond preventive programs. It also reduces unplanned downtime by up to 75% and cuts maintenance costs by up to 30% and saves roughly 8-12% over preventive maintenance and up to 40% over reactive maintenance.
These are not marginal efficiency gains. For a contractor running field crews across hundreds of transmission structures, the difference between reactive and predictive maintenance is the difference between margin erosion and margin control.
Condition-based triggers need condition data, and for most grid assets - poles, crossarms, insulators, hardware - no sensor will ever supply it. Standardized inspection imagery fills that gap: visual predictive maintenance turns repeat capture into the baseline, trend, and forecast that condition-based programs run on.
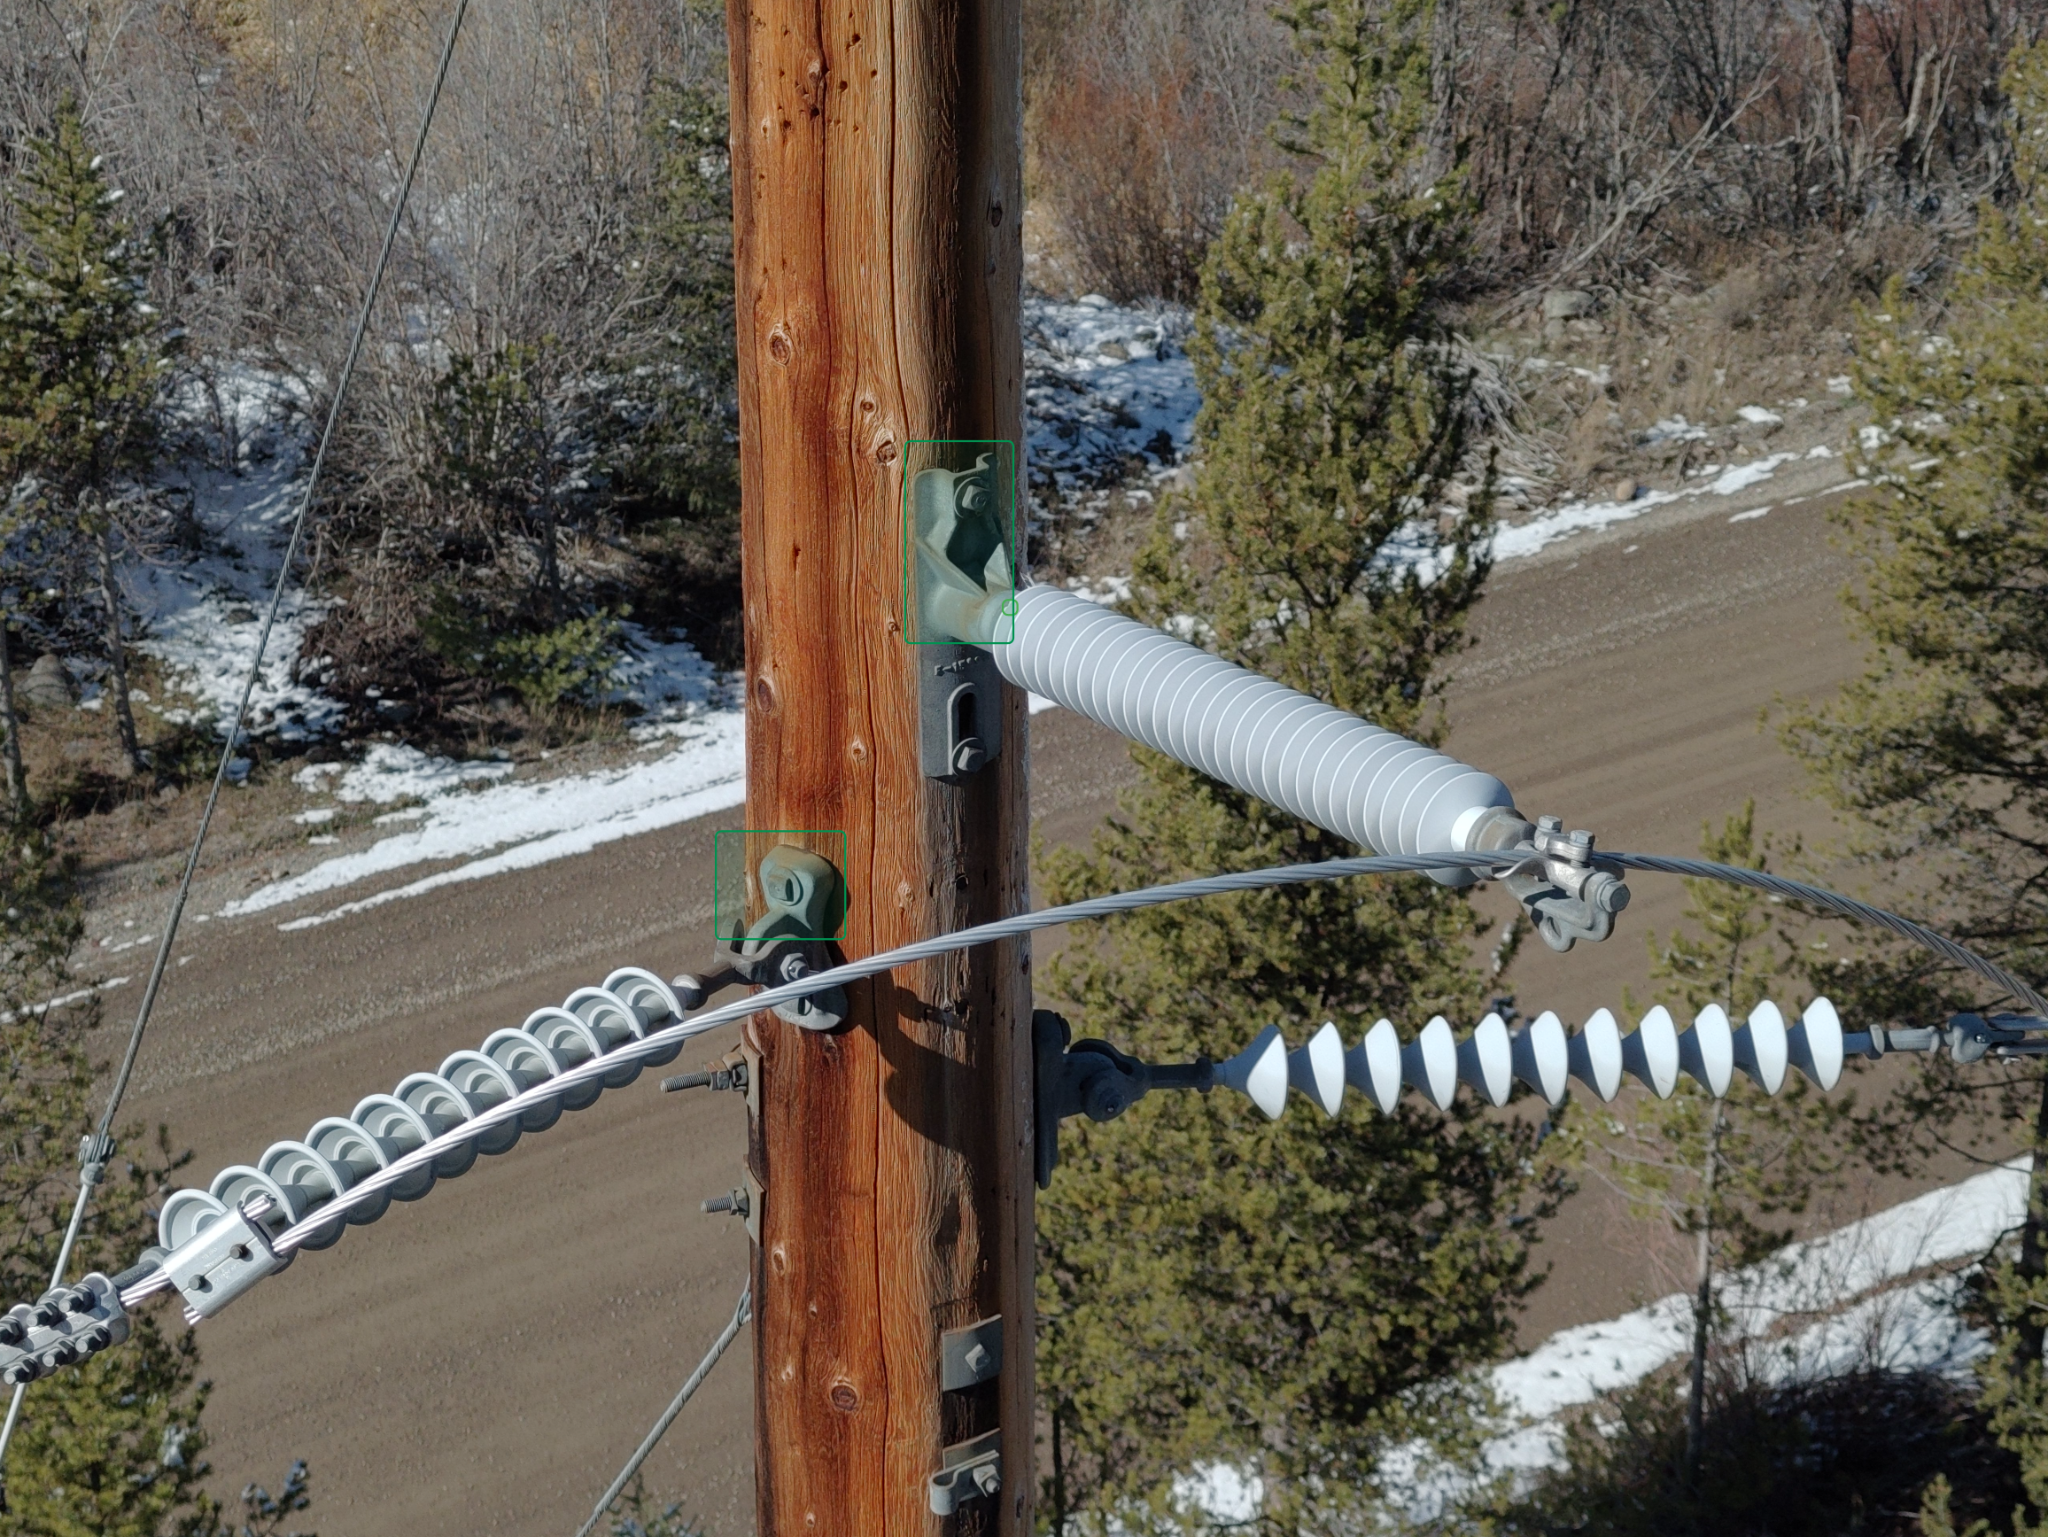
AI-driven fault detection has reached accuracy levels that flip the risk equation
The accuracy numbers on AI-based fault detection have quietly reached a point where the risk calculation has reversed. Deploying AI-driven inspection is now lower-risk than continuing without it.
Detection accuracy
AI-based fault detection models achieve 85-95% accuracy. For context, that range meets or exceeds the consistency of experienced human inspectors working across large asset portfolios, without the fatigue, variability, or scheduling constraints.
False alarm reduction
Recent research has documented AI models cutting false alarms by 50%. This matters enormously in the field. Every false positive triggers a truck roll, a crew dispatch, and wasted hours on an asset that didn't need attention. Halving that rate changes the deployment math for every field service organization.
Restoration speed
One peer-reviewed study found AI-powered systems reduce power restoration times by up to 60%. Self-healing grid mechanisms powered by reinforcement learning can autonomously isolate faults and reconfigure energy distribution, preventing nearly 45% of potential service disruptions before customers are affected.
The asset performance management market is pricing this in. Your competitors are too.
When investment capital moves at the scale and speed reflected in current market projections, it tells you the early-mover window is narrowing.
Where the money is going:
- Predictive maintenance for grid assets: $10.8B in 2025, projected to $57.7B by 2035 (18.2% CAGR)
- Energy and utilities asset performance management: $4.83B to $11.43B by 2033 (11.4% CAGR)
- AI-powered smart grid: $6.62B to $12.79B by 2030 (14.1% CAGR)
- DERMS: $780M to $2.76B by 2033 (16.7% CAGR)
- Utility asset management (overall): $5.35B in 2025, projected to $9.81B by 2034
Far from being speculative spending, these represent capital allocations by utilities, grid operators, and service providers who have already run the numbers.
The workforce shortage is a forcing function
There's a common framing of the labor shortage as a "challenge" or a "headwind." The data suggests something more urgent: it's a forcing function pushing organizations toward AI-augmented field operations whether they planned for it or not.
The numbers
- 76% of employers in grid-related roles report difficulty filling positions, and that figure climbs to 89% specifically in transmission, distribution, and storage
- Demand for grid modernization workers continues to outstrip supply, even as the sector adds headcount
- The gap is structural, not cyclical. Retirements are accelerating, and training pipelines are years behind
How organizations are responding
Contractors are deploying blended workforce models: mentor-on-call programs, AR-assisted remote support, and tiered crew structures that extend the capacity of experienced technicians. These are not future-state concepts. They're active responses to the reality that you cannot hire your way out of this shortage on a timeline that matches the work pipeline.
For contractors and DSPs alike, the organizations investing in digital field tools and AI-augmented workflows now are positioning themselves as preferred partners for utility infrastructure asset management programs that will run for the next decade.
The contract model is shifting under everyone's feet
Perhaps the most consequential finding for field service organizations: high-maturity field service organizations are 8.5x more likely to operate as profit centers and 6x more likely to emphasize revenue generation compared to lower-maturity peers.
What's driving the shift
Utilities are moving from time-and-materials contracts to outcome-based and performance-based contracts tied to SLA guarantees around asset uptime. This rewards organizations that can demonstrate data-backed reliability improvement with hard metrics. It punishes organizations that can't prove what they found, when they found it, and whether they fixed it correctly.
What this means in practice
If your inspection data is trapped in spreadsheets, your defect documentation is inconsistent, and your reporting cadence depends on manual compilation, you're losing contracts to competitors who deliver continuous, auditable asset intelligence. The pricing pressure isn't coming from cheaper labor. It's coming from better data.
Where to start with predictive asset management (and what to skip)
The comprehensive overhaul approach rarely works. The organizations making the fastest progress are starting narrow and building outward.
Start with high-criticality, high-cost assets
Transformers, switchgear, and underground cable are the logical entry points for any predictive maintenance program. Failure costs are largest, sensor technology is proven, and the ROI payback period is shortest. These asset categories generate the data and the business case needed to expand across the portfolio.
Build on clean data infrastructure
Asset performance management programs fail without clean, continuous, well-labeled asset data. Organizations that haven't standardized their GIS, asset ID, and sensor data architectures will struggle to deploy AI analytics meaningfully, regardless of what platform they select.
Integrate into unified platforms
The strongest utilities are building unified data platforms that connect asset condition, GIS, work orders, and operational systems into a single operational picture. Contractors and DSPs that can operate within and contribute to these environments will be more deeply embedded in utility operations than those running siloed tools.
Skip the point solution bolt-on
Adding a standalone AI tool on top of fragmented data and inconsistent processes doesn't produce predictive capability. It produces expensive noise. The foundation has to come first: consistent image capture, accurate asset association, reliable data quality. Everything downstream depends on that.
See where your data stands
Every capability discussed in this article depends on one thing: structured, consistent, utility-grade asset data. Whether you're a contractor managing post-construction QA or a DSP scaling drone operations across transmission corridors, the quality of your inspection data determines whether AI and predictive tools actually work for you or just add cost.
Detect's Data Quality Program standardizes the capture-to-delivery pipeline with automated scoping, 3D shot sheets, self-guided flight paths, and integrated QA that flags issues before your crew leaves the site. Request a free asset audit to see where gaps exist in your current inspection data and what closing them would mean for your margins.
Related reading: See how utilities put predictive maintenance into practice with predictive grid intelligence.
