
Data’s Journey — Part 4: Annotations
Overall Project Stats
- Structures Inspected: 1314
- Photos Taken: 39,401
- Defects Detected (compared to previous inspection): 10X
- Total Distance: 220 km
- Total Inspection Time: 22 Days
- In-field Team Composition: Pilot, Safety Officer, and Data Manager
“Data is the new gold. Annotation is the new panning.” — Unknown
In this fourth installment, we’ll discuss how we annotate and review data. Given the volume of photos and the focus needed to inspect a structure, a clear workflow is critical in order to annotate efficiently and effectively. This project involved two parallel transmission lines, L23(A) and L24(A), spanning approximately 220 km between Wabush and Churchill Falls, NL.
Preparing to Annotate
Every customer we work with has unique needs, so we create a custom list of deficiency criteria for every project before our field team sets out. Once the deficiency criteria are confirmed, our drone pilots then head out to the field to capture images, which are uploaded to Detect’s platform. These images, once organized, pass through our proprietary data pipeline and are then ready for examination by our Powerline Technicians — whom we refer to as Annotators — for any deficiencies.
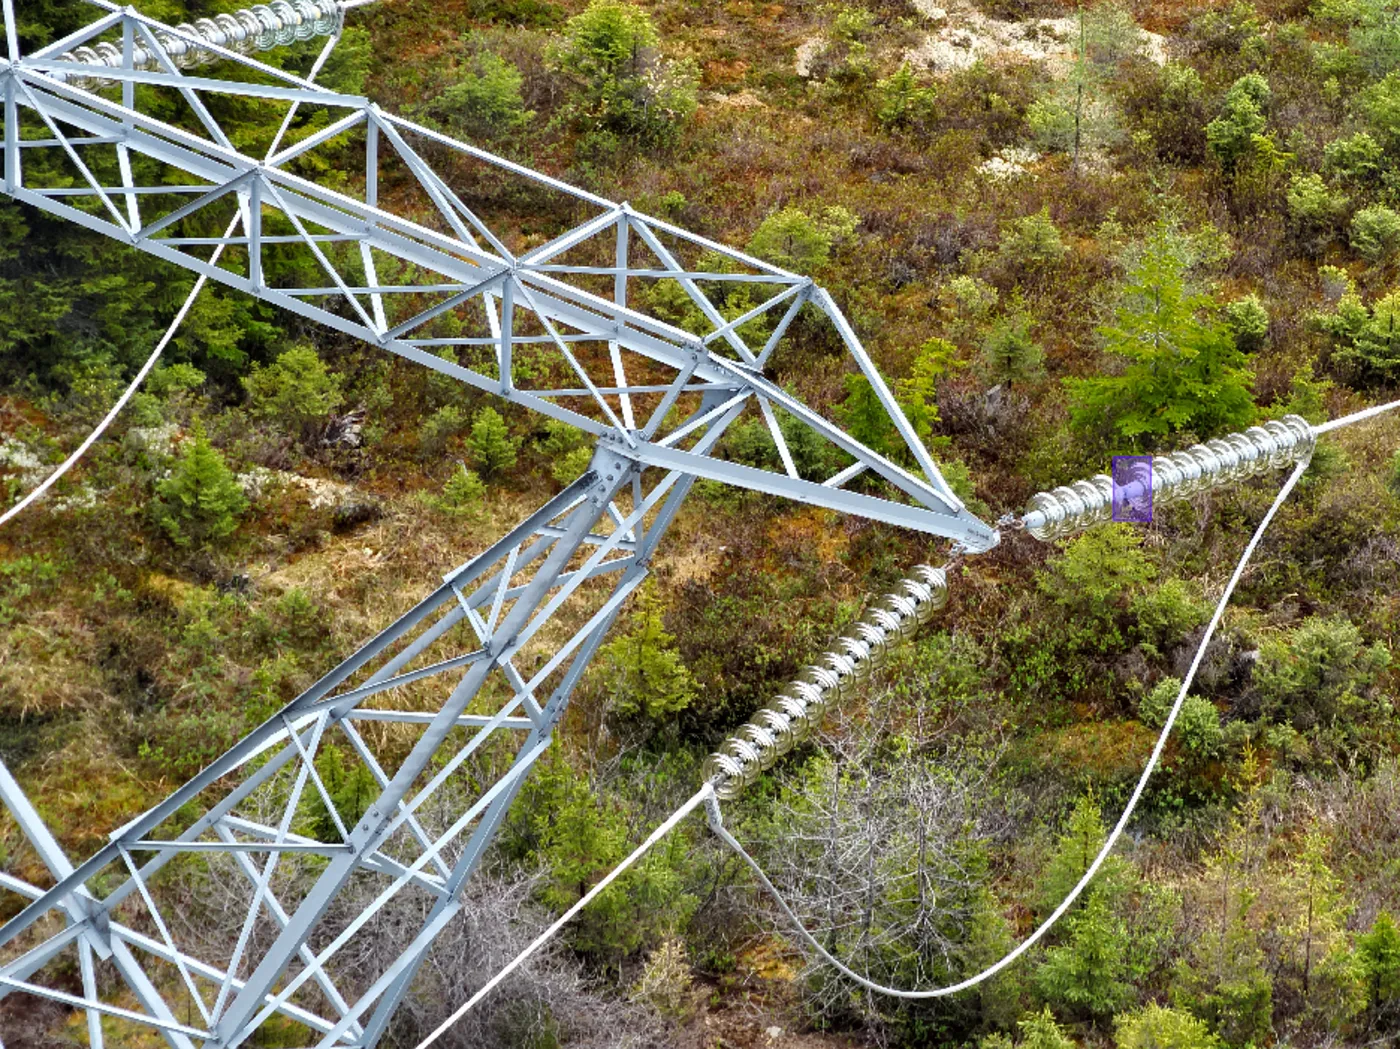
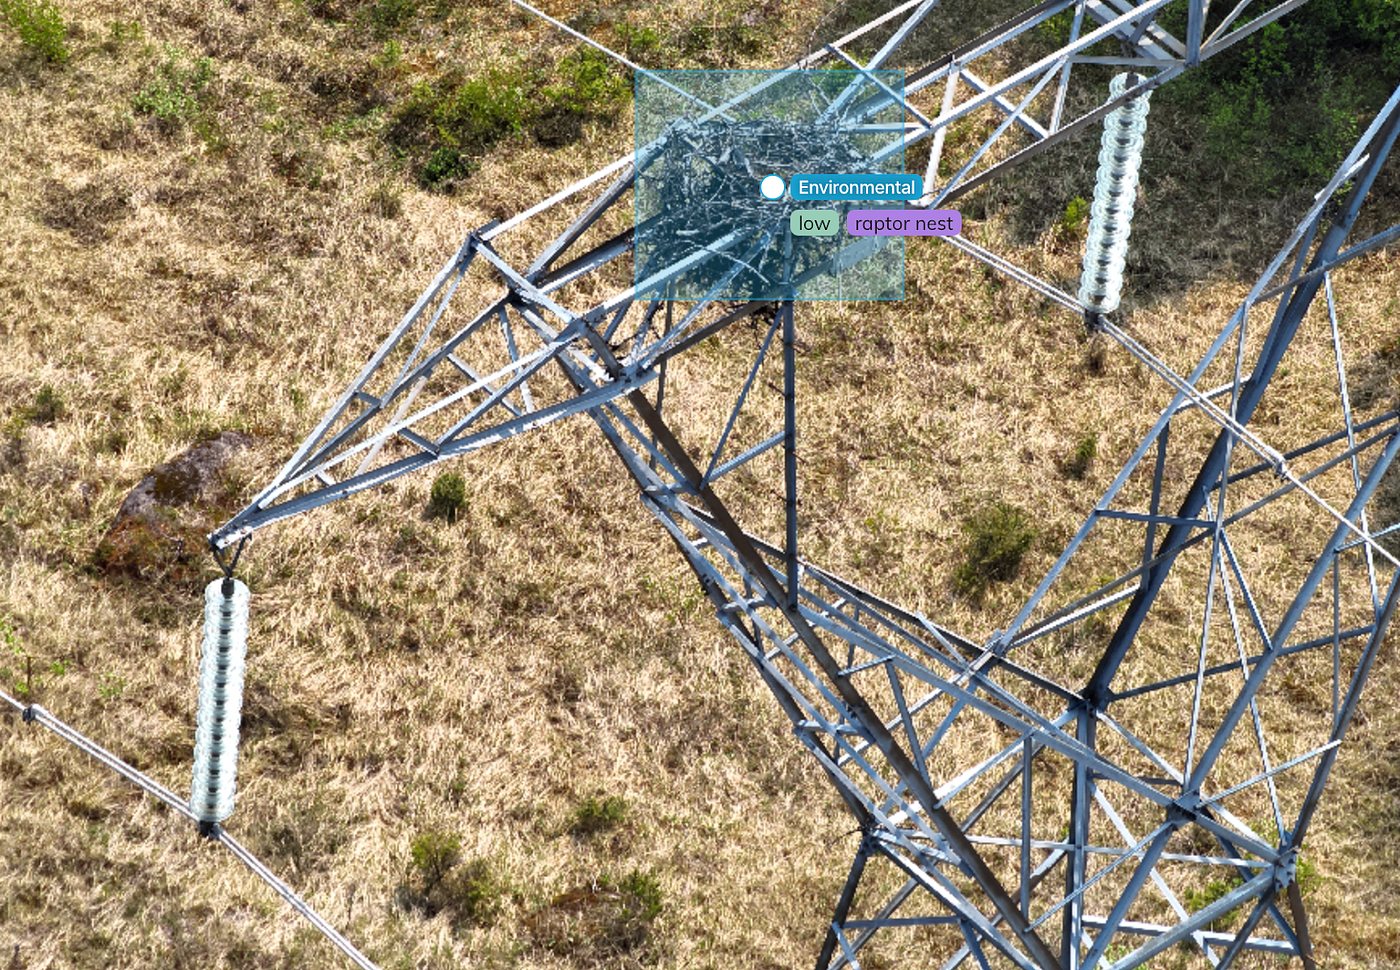
With images now neatly organized, images are automatically sent to our annotators where they give context to these images. In this inspection, our inspection criteria spanned from bent/broken members to environmental hazards including raptor nests. Our annotators were supplied with engineering drawings, the inspection criteria and the images organized by structure.

Inspection at Scale
Armed with this information, they began their inspection. With nearly a hundred structures per day (or thousands of images per day), annotators need every tool at their disposal to accurately review images as best as they can. This involves providing them access to additional image metadata like direction of an image as well as infield notes provided by the inspection team.
Given the specific requirements of this job, it was important for annotators to understand all of this available information for two reasons. First, to only annotate a defect once. This is especially prevalent as with the number of images taken by the inspection team, many of the defects may be captured multiple times. Second, the team was required to identify the correct steel member IDs and leg numbers. This information would later be used for structure modelling and future construction work, all of which requires accurate understanding of what steel members need replacement.
Once annotations are complete, they go into our review process. Given the number of photos to review, the number of steel members to inspect and the defects to look for, it is nearly impossible to expect perfection with a single inspection. Here, the data is reviewed by multiple reviewers and experts to ensure the annotations are done accurately and nothing is missed. Reviewers are given the same tools as our annotators and can see exactly what the initial inspection has identified. Once complete, reviewers can either decide to reject the annotations, edit the annotations or approve them.
The beauty of our process lies in its digital nature. Our expert Annotation team can inspect the powerline assets without being on-site. They can do their work from anywhere in the world as long as they have an internet connection. This setup not only saves the cost of travel but also eliminates the need for our team to work out in the field, making the process more efficient, safe and flexible.
What is next
With the completion of the inspection, we move to the final stage: data consumption. Our users need an easy way to view this defect data and the inspection as a whole. In the final post of this series, we will dive into how we visualize this data and make it available for our users through our platform SCOPE.
This post was part of a series detailing Detect’s data journey, produced in partnership with Newfoundland & Labrador Hydro and Stantec.