
Data’s Journey — Part 2: Data Collection
Overall Project Stats:
- Structures Inspected: 1314
- Photos Taken: 39,401
- Defects Detected (compared to previous inspection): 10X
- Total Distance: 220 km
- Total Inspection Time: 22 Days
- In-field Team Composition: Pilot, Safety Officer, and Data Manager
“There’s a way to do it better — find it.” — Thomas Edison
In this second installment, we’ll discuss the data collection stage of a recently completed project, the 230kV transmission line inspection in Labrador, Canada. This project involved two parallel transmission lines, L23(A) and L24(A), spanning approximately 220 km between Wabush and Churchill Falls, NL.
Standard Shot List
As described in the previous part of this series, the shot list was pre-determined with the customer to ensure all elements of the structure were captured efficiently.
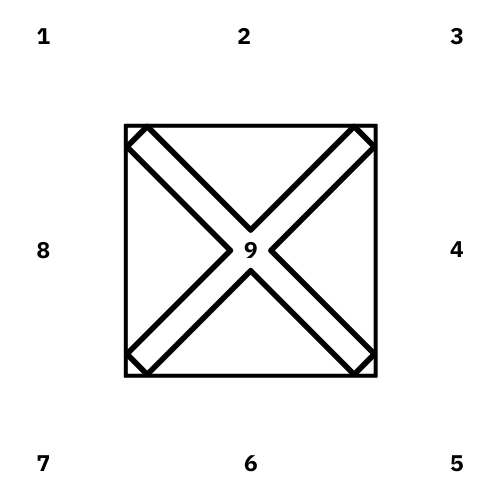
Our team pre-determined the data capture sequence as follows:
- Wide angle shot from (1–8)
- Close-up shots of the structure from top to bottom of the corners (1,3,5 and 7) at around 10X zoom
- From corner 1, 40X zoom shots were captured of the insulator connection points — a key area of concern selected by the customer for additional review
- Top shot (9) to help determine if the structure was leaning
- If a deficiency was immediately found by the pilot during the flight operations, an additional shot would be captured in greater detail in order to clearly show it to the annotator during the labeling stage.
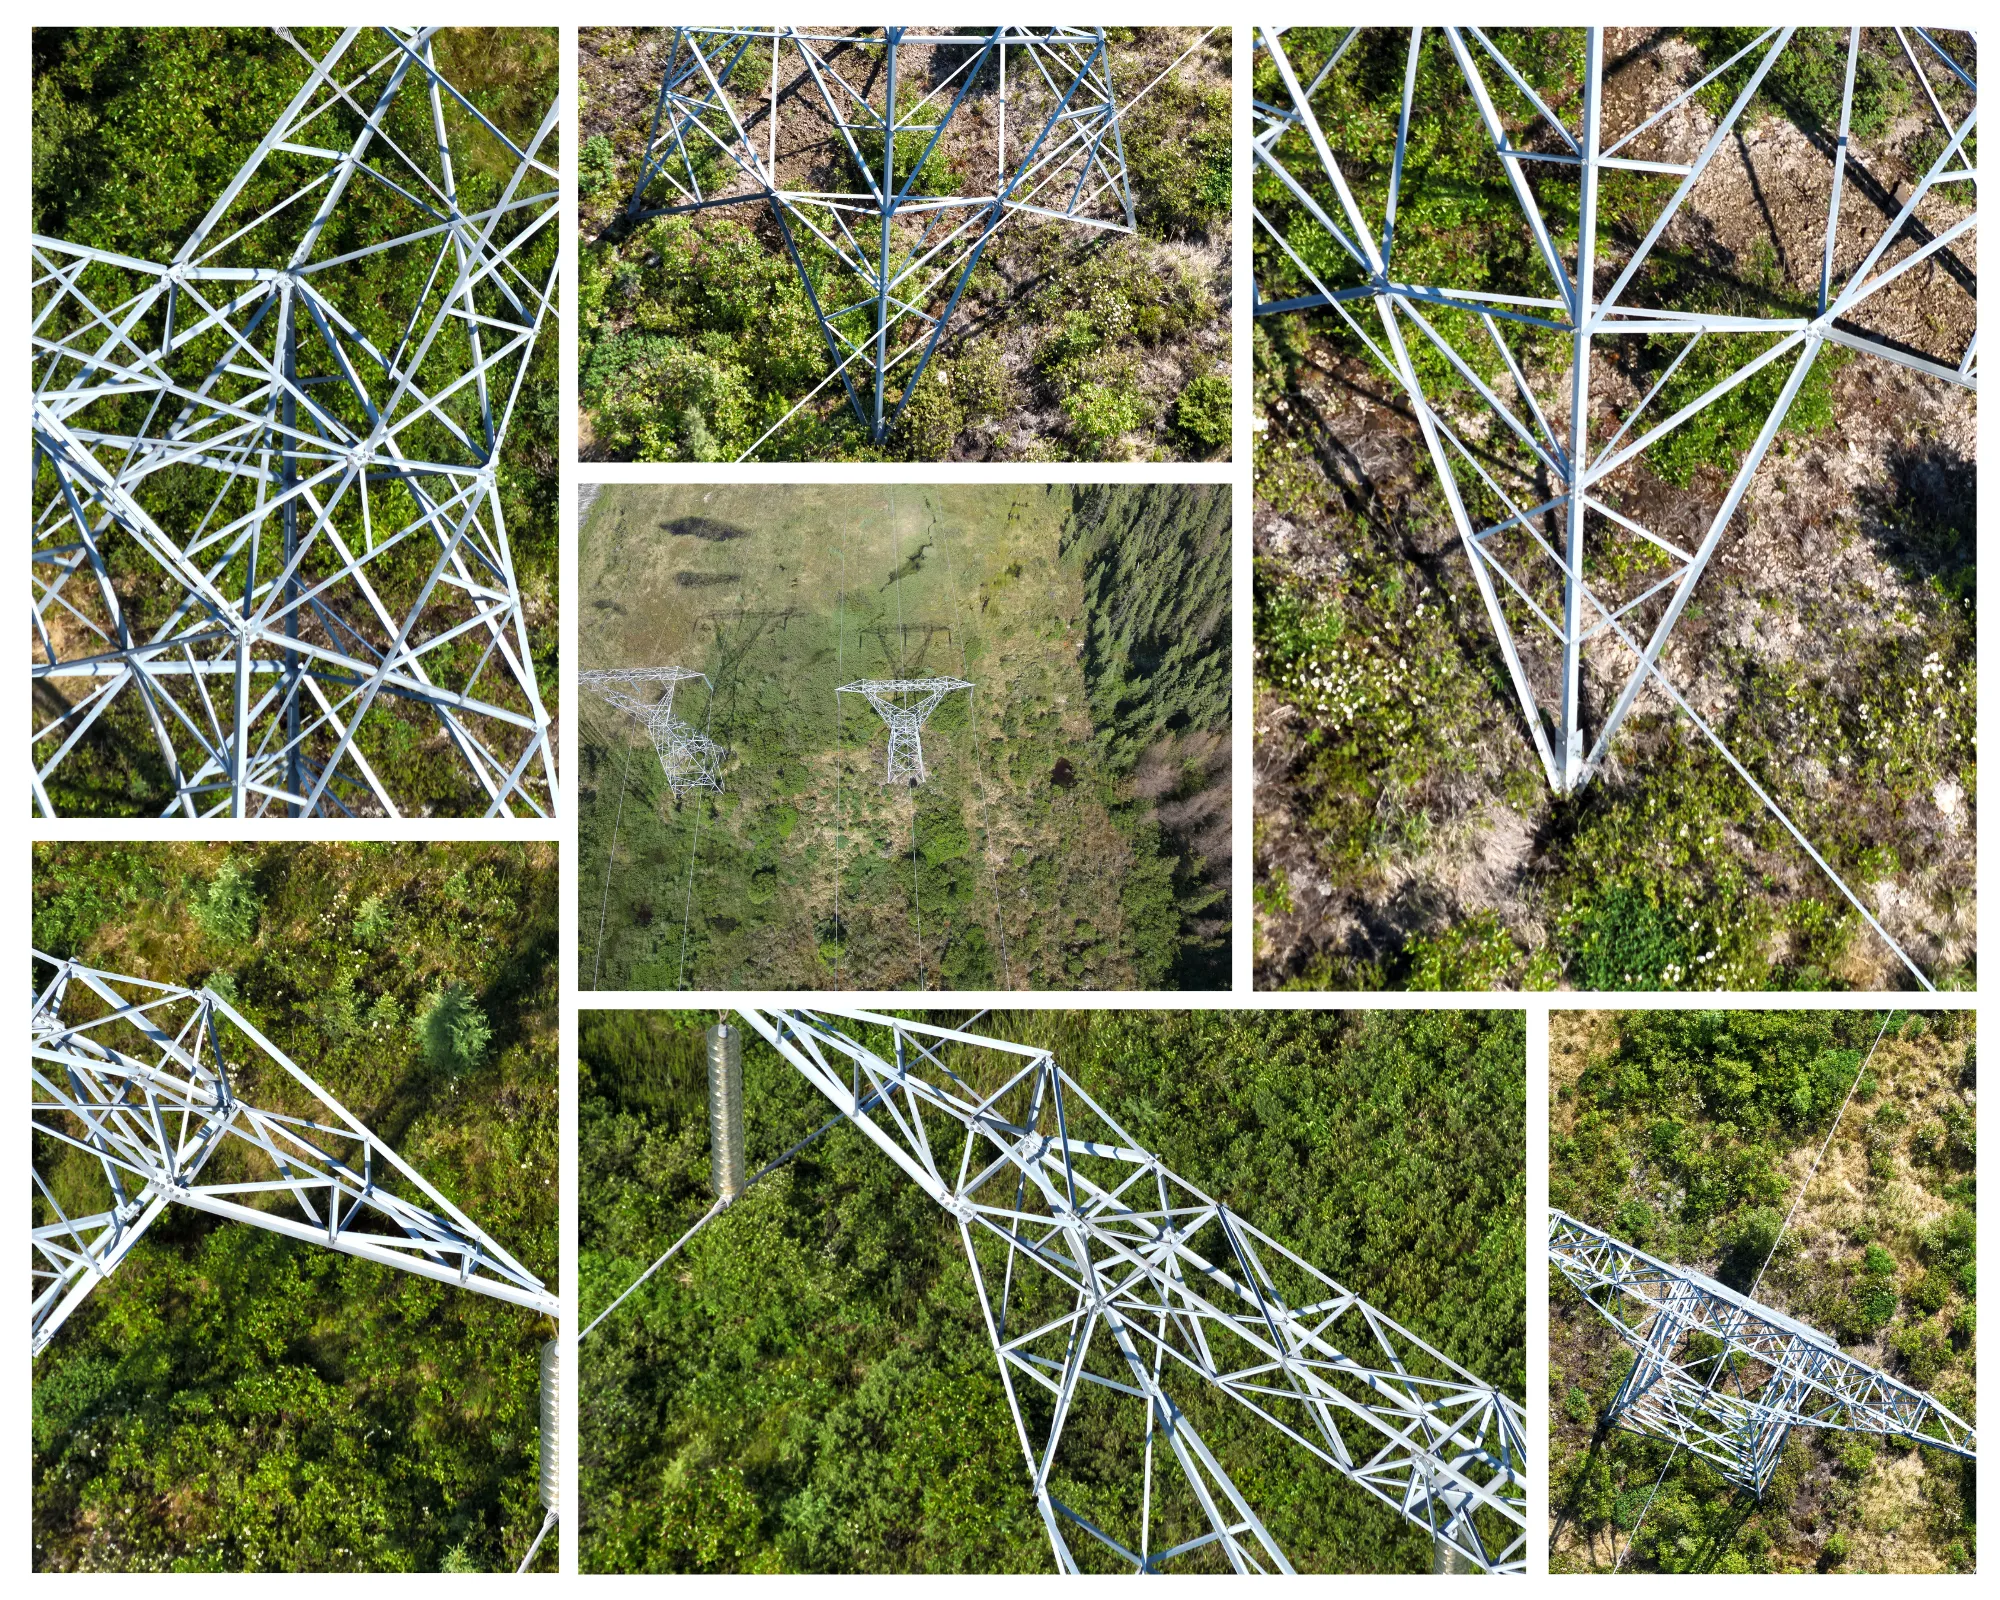
See the procedure in action with a sample steel tower as shown in the video below:
In the Field — Data Collection
In general, our data collection methods were largely the same, however, specific procedures, equipment, and operations varied by access method. We’ll classify these three as roadside, ATV, or Helicopter.
Firstly, let’s cover what steps remained the same no matter the access method.
Every day generally started the same way: the Pilot would review the flight plan and discuss with the team the overall anticipated structures that they would try and capture. Included in this review would be any access points/trails required, potential obstacles, active/inactive raptor nests and more.
In parallel, the safety officer would complete a daily risk assessment every morning prior to the work being undertaken. At Detect, daily risk assessments play a crucial role in ensuring a streamlined and safe operation process. These assessments begin by ensuring that all drones, equipment, and operating practices adhere to regulatory standards and safety protocols, safeguarding the integrity of both the personnel involved and the powerlines being inspected. By identifying potential hazards and understanding the associated risks, the company can take immediate and appropriate actions to mitigate those risks.
This process of risk identification and mitigation doesn’t just enhance safety but also facilitates more effective resource allocation. Whether it’s the allocation of additional safety measures, equipment, or personnel to high-risk operations, daily risk assessments allow the company to proactively adapt and ensure that the resources are used where they are most needed. This comprehensive approach to daily risk management is integral to maintaining efficiency and preventing accidents within the complex environment of powerline inspections.
The Data Manager would ensure all of the previous day’s data had been synced overnight and that the SD cards were wiped fresh for the new day.
Now that we’ve covered what happens every day, regardless of access type, let’s see what differs.
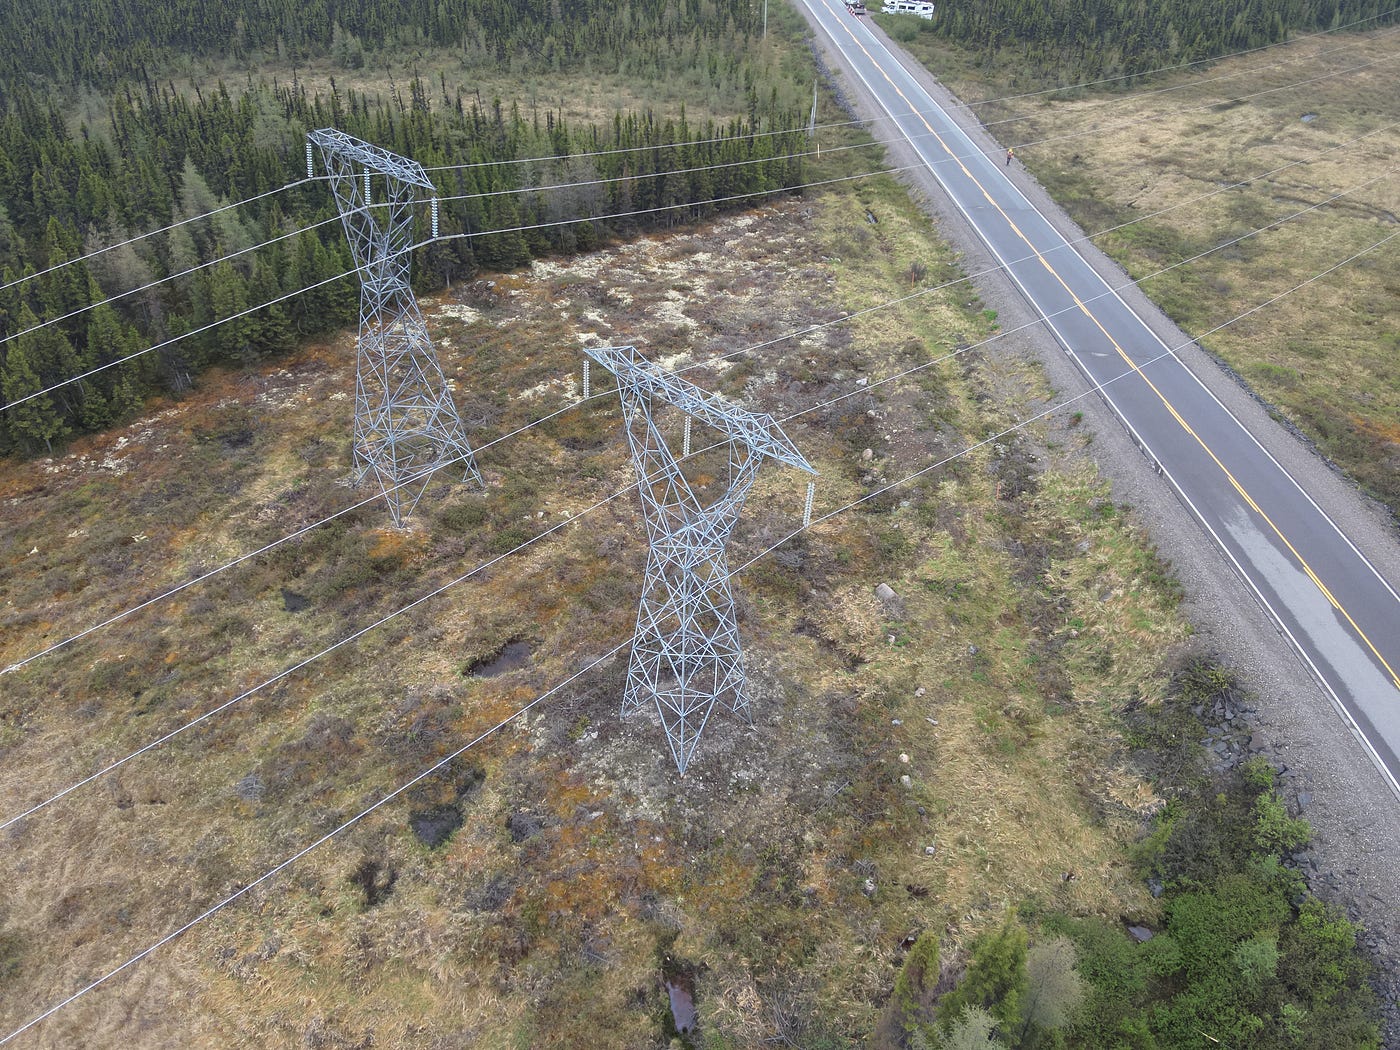
Roadside Access
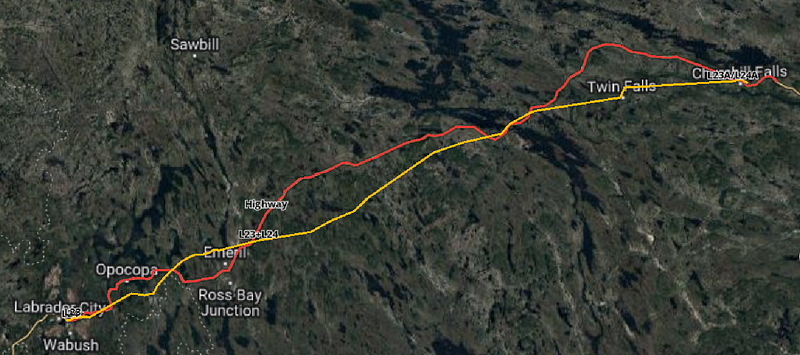
In the detailed map provided, two significant routes can be observed; the yellow line indicates the powerline route, while the red line represents the highway route. As shown, there were not many instances where the powerline crossed the road, offering a straightforward inspection process. In a few locations, the powerline ran somewhat parallel to the road, allowing us to target around 15–20 structures by taking off from the roadside. The highway itself had very little traffic, but we prioritized safety by highlighting risks on the tailboards and implementing precautions such as cones, hazard lights, and spotters for oncoming traffic. These measures ensured that the area was secure while our team conducted the inspection, benefiting from a quick drone setup time, which further streamlined the process. The simplest of all access types, generally approximately 10 structures on either side of a road crossing could be inspected from the same take-off location.
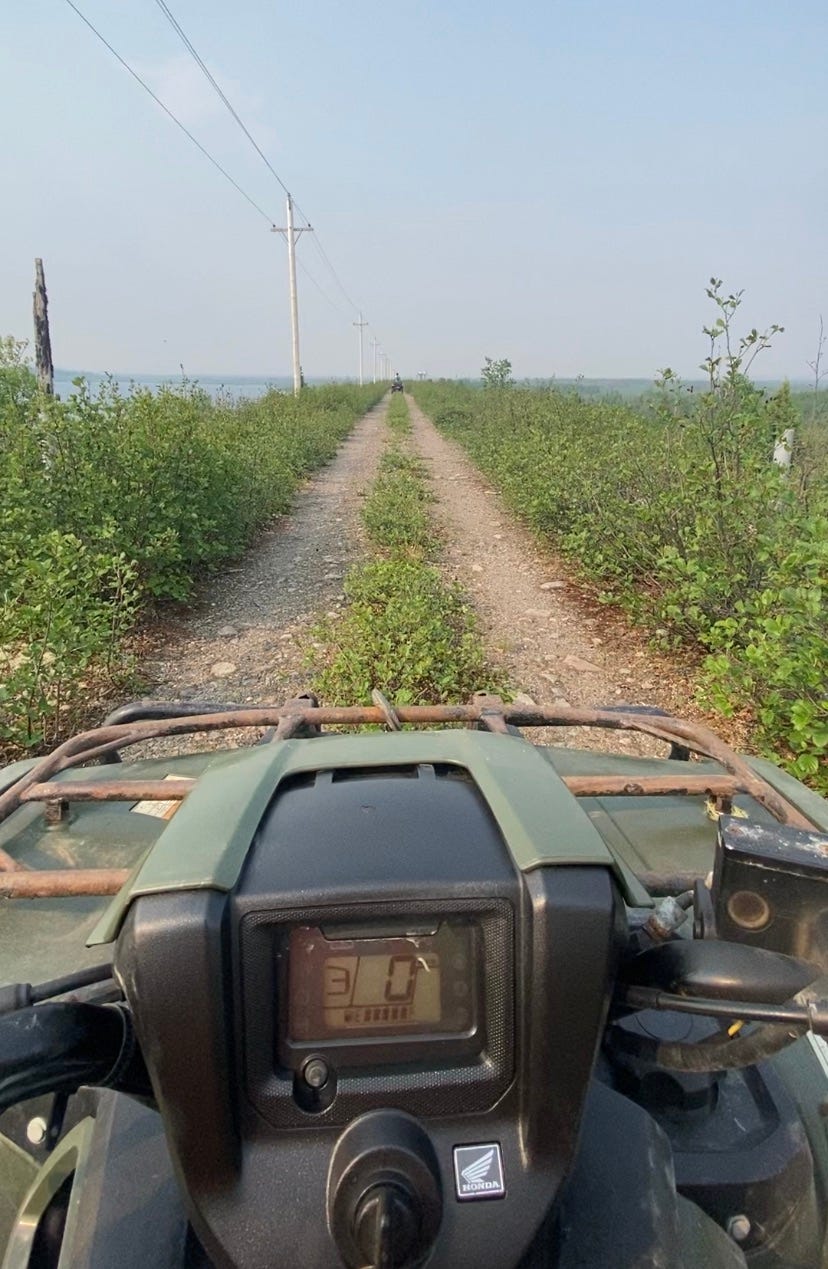
ATV Access
Labrador is known for its rich network of ATV trails and Detect were able to leverage their use to access many remote transmission structures. Our team had access to high-speed internet even in the most remote areas with no cellular service with the help of battery powered Starlink. It was mounted to the ATV so we could always maintain contact with our team and not interrupt our data uploads.
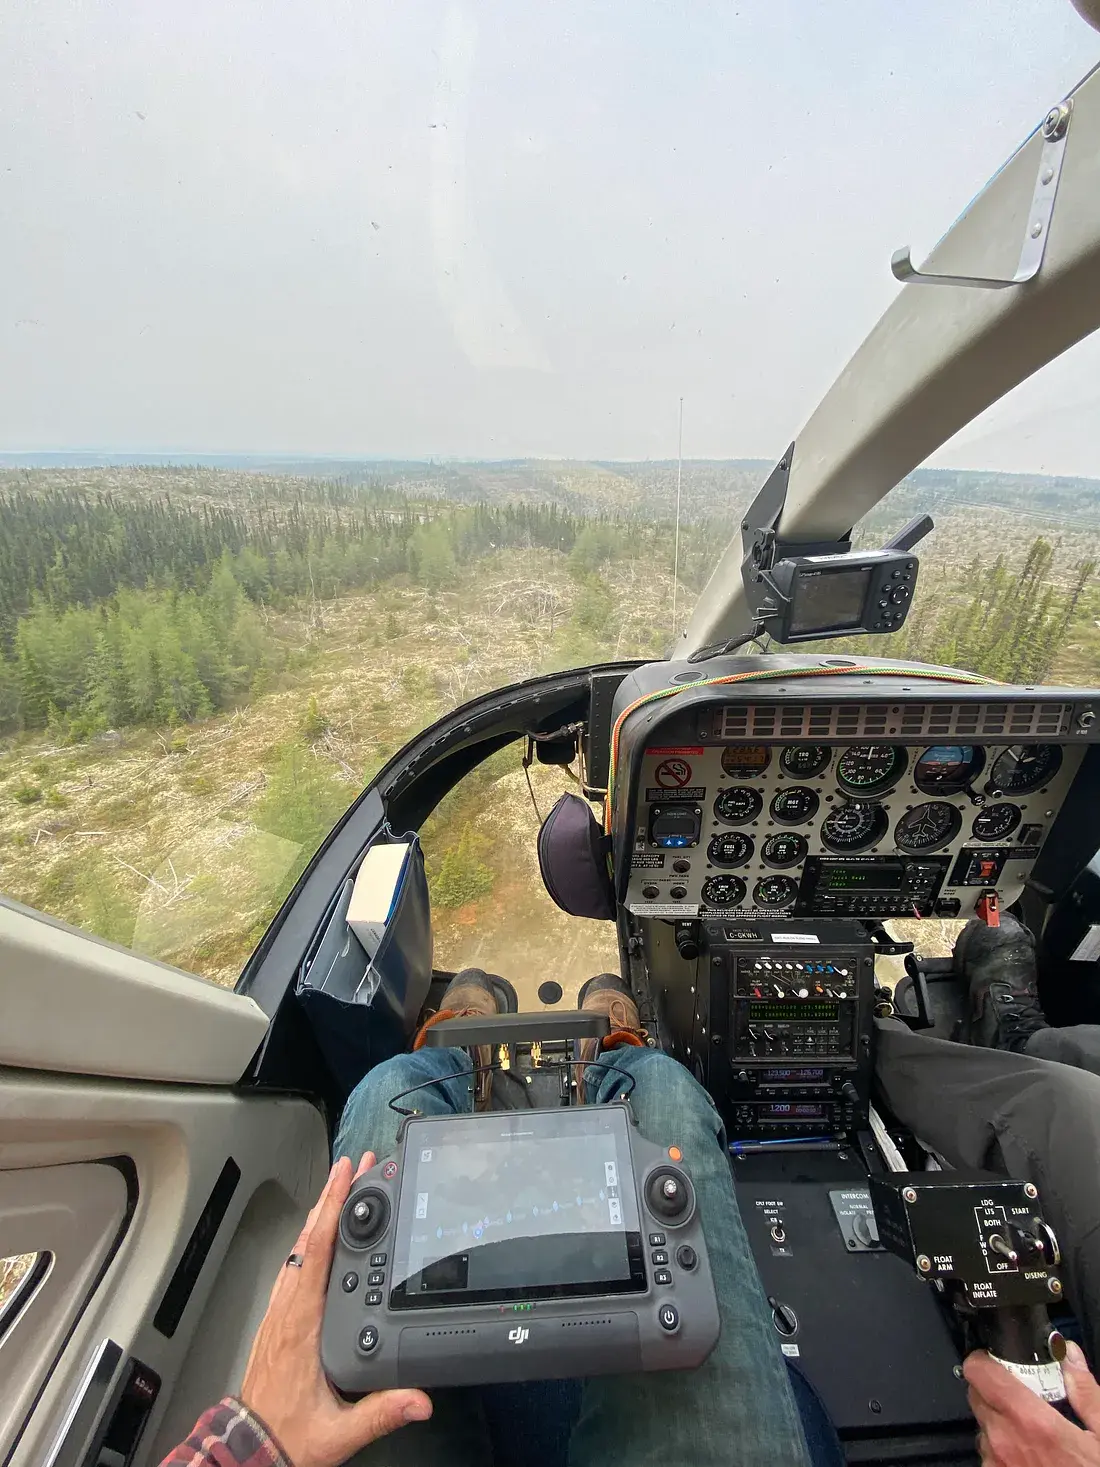
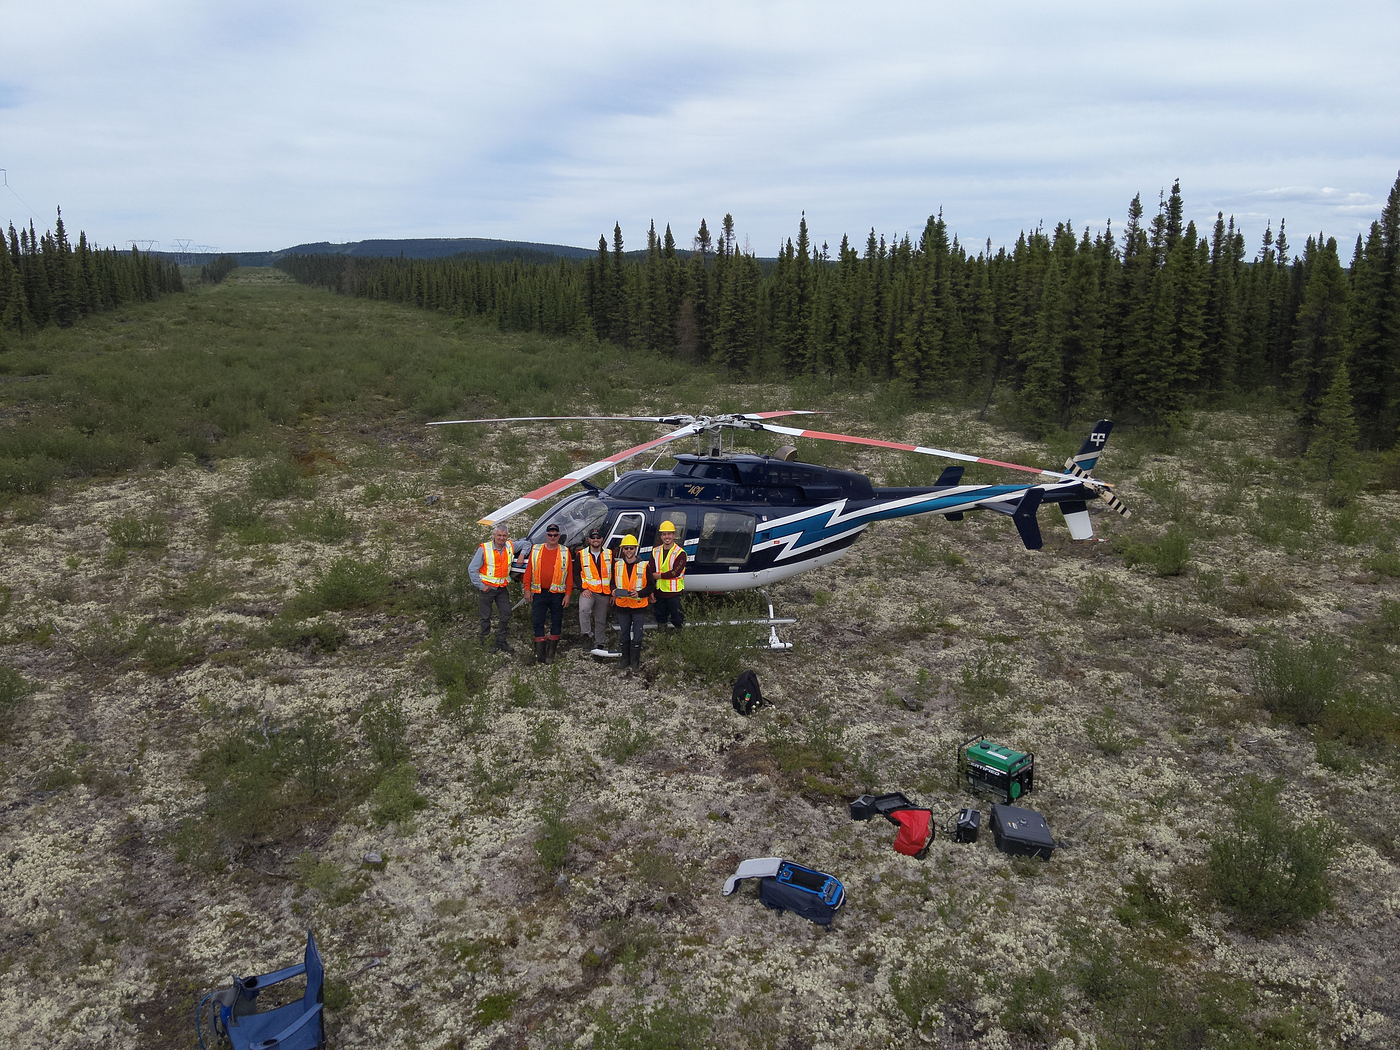
Helicopter Access
In the most remote areas of L23(A) & L24(A), a helicopter was required to get access to the structures. Fortunately, Newfoundland and Labrador Hydro had their own helicopter and graciously allowed our team to use it to access these extreme remote structures.

Generally, the helicopter days would go as follows:
- The helicopter pilot would drop off utility workers elsewhere then pick up the Detect team
- The Detect team would direct the helicopter pilot to the structure that we needed to land at to undertake our data collection
- Once arrived, the helicopter pilot would land turn off the aircraft. Once safe, the Detect team would exit and get to work
- The Starlink, generator and drone would be setup and the drone pilot would capture approximately 10 structures East, and 10 structures West for each line (total time was approximately 1.5 hours per stop)
- Once completed, everything would be packed up and the team would take off in the helicopter to the next required structure. This would repeat until the helicopter was no longer available
- At the end of the day, the helicopter would drop the Detect team back to the RV and go back to pick up the utility workers elsewhere
We’ve now got the data , our next step upload and organize our data!
In the next post of the series, we dive deeper into the process of data organization. Stay tuned as we continue on Data’s Journey.
This post was part of a series detailing Detect’s data journey, produced in partnership with Newfoundland & Labrador Hydro and Stantec.